- Samira Hassan 1

- Fairuza Ahmed 2
- Razwanur Rahman Tushar 3
- Laila Jahan 4
- Md. Abul Hossen 4
- Published On: 2021-08-27|
- DOI Link :
 |
| - Download: |
- Article Information |
- Article Metadata |
- Share
- Received On: 2021-08-09|
- Accepted On: 2021-08-23|
- Published On: 2021-08-27
| Article Metadata | |||
|---|---|---|---|
| 1 | Submitted Manuscript | PPD/MIN/218/1 | |
| 2 | Cover Letter to Editor | PPD/CLE/218/1 | |
| 3 | Copyright Transfer Letter | PPD/CTL/218/1 | |
| 4 | Authors’ Consent Letter | PPD/ACL/218/1 | |
| 5 | Initial Editorial Screening Report | PPD/IESR/218/1 | |
| 6 | Review Agreement Letter (Reviewer 1) | PPD/RAL/2181/R1 | |
| 7 | Review Agreement Letter (Reviewer 2) | PPD/RAL/2181/R2 | |
| 8 | Manuscript Review Report (Round 1, Reviewer 1) | PPD/MRR/2181/R1.1 | |
| 9 | Manuscript Review Report (Round 1, Reviewer 2) | PPD/MRR/2181/R1.2 | |
| 10 | Revised Manuscript | PPD/MIN/2181R | |
| 11 | Review Response Letter (Round 1) | PPD/RRL/2181/R1 | |
| 12 | Manuscript Review Report (Round 2, Reviewer 1) | PPD/MRR/2181/R2.1 | |
| 13 | Manuscript Review Report (Round 2, Reviewer 2) | PPD/MRR/2181/R2.2 | |
| 14 | Final Editorial Screening Report | PPD/FESR/2181 | |
| 15 | Letter of Acceptance and Acknowledgement | PPD/LAA/2181 | |
| 16 | Accepted Manuscript | PPD/MIN/2181A | |
| 17 | Galley Proof Manuscript | PPD/MIN/GPM/2181 | |
| Request Access | |||
| Supplementary Data | ||
|---|---|---|
| The datasets used and/or analyzed during the study are available from the corresponding author on reasonable request. | ||
| Datasets | Not Provided | Request Availability |
Abstract
Background: The aim of this study was to evaluate the pharmaceutical equivalence of different brands of Domperidone tablets marketed in Bangladesh and study their release kinetics model.
Methods: Five different brands of Domperidone tablets were purchased from different pharmacies from Dhaka, Bangladesh. The quality control parameters of domperidone tablets were determined by identification, weight variation, disintegration, assay and dissolution tests and the results were compared with USP and BP pharmacopoeia standards. Difference (f1) and similarity (f2) factors were calculated to assess in vitro bioequivalence requirements. Finally, drug release kinetics were studied through model-dependent calculative methods.
Results: The results of assay, weight variation and disintegration tests indicated that all samples complied with USP specification limits. The active pharmaceutical ingredients quantitative assay showed that all the brands of domperidone tablets were between the 95% and 105% limit of the label claim met the range of f1 (0-15) and f2 (>50). All brands best fitted in Korsmeyer-Peppas model indicating diffusion mediated release and also shown low AIC in Hixson-Crowell model assuming the release governed by velocity of dissolution.
Conclusion: This study revealed that all the domperidone brands met the quality specification of weight variation, disintegration, assay and dissolution. The study also indicated similarity in the dissolution profile of the brands of domperidone tablets with the reference product. Hence, selected generic brands could be substituted with the reference product in clinical practice.
Introduction
Dissolution testing is a quantitative and qualitative technique that assesses how efficiently a drug is released from its dosage form [1]. Dissolution profiles play a key role in evaluating the impact of formulation composition and other process parameters on the bioavailability of the drug. However, dissolution study is incomplete without its validation, which ensures consistency and accuracy with repeated results. In manufacturing, dissolution test is routinely performed as a requirement of quality control (QC) release test to ensure batch-to-batch consistency. It is also a part of regulatory requirement to apply for a waiver of in vivo bioequivalence studies [2,3].
Domperidone, a benzimidazole derivative, is classified as a BCS (biopharmaceutical classification system) Class II drug because of its poor water solubility and high permeability [4]. It is primarily absorbed from the stomach by active transport, after oral administration, and few side effects have been reported. Being a weak base, it has good solubility in acidic pH though in alkaline pH its solubility is significantly compromised. The biological half-life of domperidone is short (7 hr) and thus favors development of a sustained release dosage form [5-7]. Its localization outside the blood-brain barrier has made it a suitable adjunct in the treatment of Parkinson's disease. Recently, there has been renewed interest in prokinetic agents like Domperidone since the withdrawal of cisapride from the market [8]. Domperidone is a great alternative to metoclopramide for treatment of upper gastrointestinal motility disorders because it has fewer neurological side effects [9].
The present study was performed to evaluate the commercially available domperidone tablets in Bangladesh for pharmaceutical equivalence using in vitro dissolution techniques. In order to claim a branded version bioequivalent with reference brand, it must contain the same amount of API and there should not be any significant different in their bioavailability. The bioavailability of a drug depends on two parameters- solubility and permeability, hence drug dissolution is important for assessing bioequivalence.
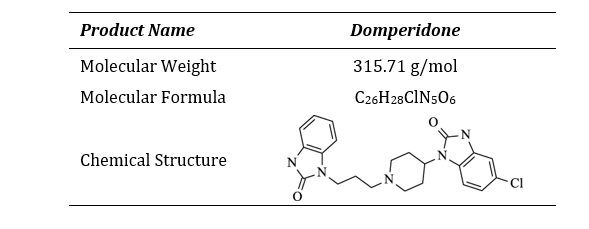
Table 1: Product Information
Methods
Drugs and Chemicals
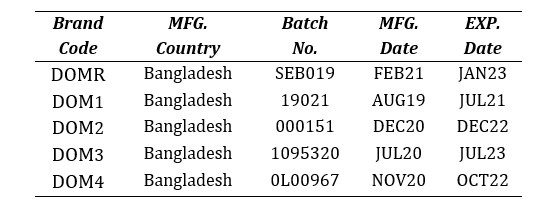
Four brands of domperidone 10mg tablets (DOM1, DOM2, DOM3 and DOM4) were purchased from local pharmacies in Dhaka, Bangladesh and compared with the market leader brand (DOMR). The brands were randomly coded so as to avoid unethical marketing practice. The samples were checked for their manufacturer license no., DAR No., batch number, manufacturing and expiry dates and physical appearance.
Table 2: List of Brands of Domperidone 10mg tablets used in vitro analysis.
Standard API of Domperidone was obtained from Sigma-Aldrich. Methanol (RCI LABSCAN Limited, Thailand) and Acetonitrile (SAMCHUN, Korea) used in the experiments were of HPLC grades.
Instruments and Devices
BK-RC3 Dissolution Tester (Biobase, China), BK-BJ2 Disintegration Tester (Biobase, China), BA2004N Analytical Balance (Biobase, China), BK-UV 1800 Spectrophotometer (Biobase, China), PH-10S pH Meter (Biobase, China), UC-20A Water Bath Sonicator (Biobase, China) were used for the experiments.
Instrument Calibration and Method Validation
A half-yearly internal calibration was performed on a routine basis following the recommended procedures as stated by the United States Pharmacopoeia (USP) as per the General Chapter <711> [10] to establish the control on absorbance and wavelength, stary light limit, photo-metric linearity, resolution power and appropriateness of baseline and sample cells. USP Prednisone Tablets RS and USP Prednisone RS served as the reference standard. The
Table 3: Specifications for calibration.
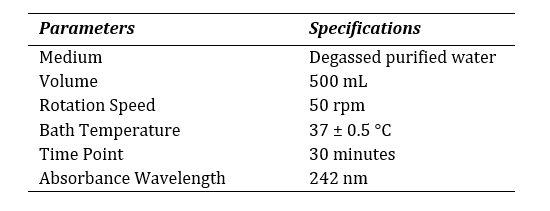
dissolution test was carried out according to the specifications mentioned at Table 3. The release of the reference drug was assessed through spectrophotometer. Alongside, the dissolution method was validated for domperidone 10mg tablet with official medium (hydrochloric acid, HCl) by the spectrophotometer at 286 nm using 10 mm quartz cell. The method was performed according to ICH Q2 (R1) guideline [11]. The following criteria was met to validate the spectrophotometric method as described at Table 4.
Table 4: Method validation report summary.
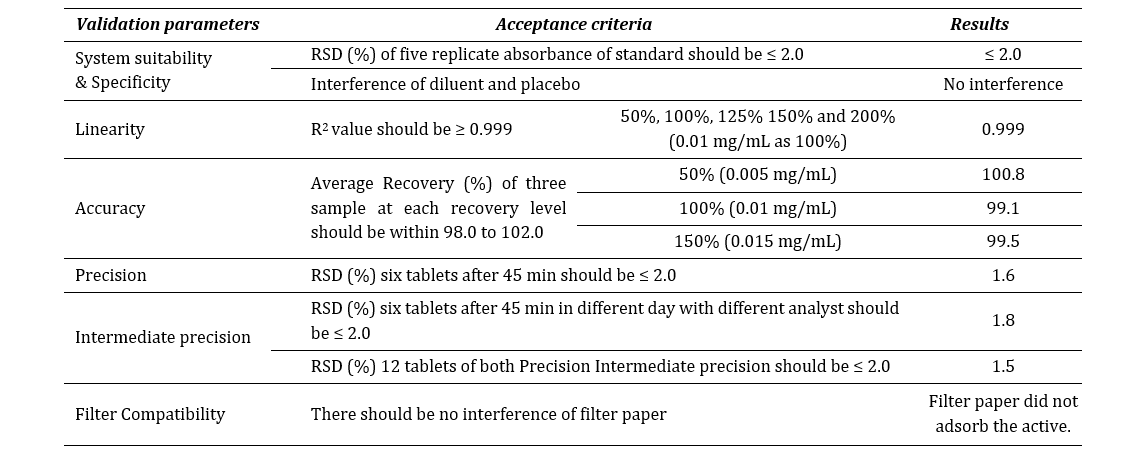
Where, RSD is relative standard deviation.
Construction of Standard Curve
A stock solution of domperidone (1mg/mL) was prepared in methanol. The stock solution was then diluted with dissolution media to prepare working solutions just before use (0.005 – 0.02 mg/mL). Domperidone concentration was analyzed by UV-spectrophotometer.
Assay
Ten domperidone tablets were weighed and powdered. Sufficient methanol was added to produce a solution containing 0.02% Domperidone, followed by sonication for 20 minutes. The mixture was filtered using Whatman filter paper. 1ml of 0.1M HCl was added to 50ml of the filtrate and sufficient water was added to make a 100ml solution. The sample was analyzed by UV/Vis spectrophotometer at 286 nm [9].
Weight uniformity
Twenty tablets were randomly selected and weighed individually using an analytical balance. The individual weights were compared with the average weight for determination of weight variation [12].
Disintegration test
USP disintegration apparatus was used for this test. Six tablets from each brand were placed in the tube in the basket rack containing 900ml distilled water at 37 ± 2 °C. As per the USP-NP standards, the time required for all the tablets to pass through the 10-mesh screen was recorded [13].
Dissolution test
USP type II apparatus was used to perform the in-vitro dissolution study. The official dissolution media was 900 ml of 0.01 N HCl, which was maintained at 37 ± 0.5 °C and 75 RPM. In each five minutes time interval up to 45 minutes, 10 ml of dissolution sample was withdrawn from every vessel and simultaneously replaced with the equal volume of fresh dissolution media. Collected samples were filtered through #41 Whatman filter paper and assayed, for determination of released Domperidone concentrations, by a UV–VIS spectrophotometer against a blank at 286 nm [14].
Model-Independent Fit Factors
Dissolution profiles of sample products were compared with the reference product using fit factors. While the difference factor (f1) measured the difference in percentage between the sample and the reference drug at each time point, the similarity factor (f2) expressed the closeness between the two curves using the formula (1) and (2) respectively [15]:
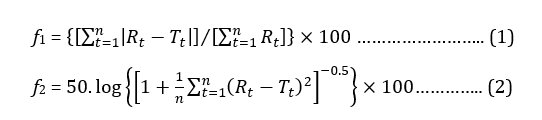
where, n is the number of time points, Rt is the dissolution value of reference product at time t and Tt is the dissolution value for the test product at time t.
f1 score within 0 to 15 signified the standard difference between the two curves whereas f2 value above 50 represents the equivalence between test samples and reference drug [16-18].
As indicators of efficient control of drug release, mean dissolution time (MDT) and dissolution efficiency (DE) were determined using the following formula (3) and (4) respectively [15,19]:
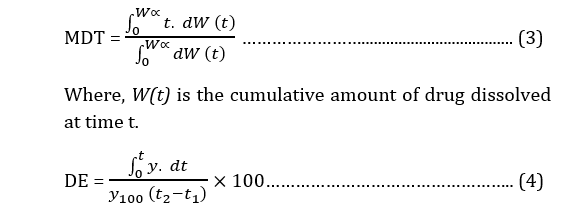
Where, y is the percentage of dissolved product. DE is the area under the dissolution curve between time points t1 and t2 expressed as a percentage of the curve at maximum dissolution, y100, over the same time period.
Model-Dependent Dissolution Kinetics
In vitro drug release kinetics and release mechanism were investigated using various mathematical kinetic models which described dissolution of drug from solid dosage forms [20]. From the analysis of dissolution data, drug release kinetics were studied through several dependent models, such as zero-order, first-order, Hixson-Crowell’s cube root law, Higuchi’s square root equation and Korsmeyer-Peppas model. Coefficient of determination (R2), adjusted R2, and Akaike information criterion (AIC) were deduced from the best fitting equation [21]. The lowest AIC and highest R2 adjusted values were considered the best-fit model [22].
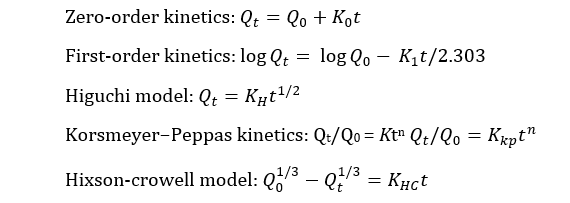
where, K0, K1, KH, KHC and Kkp indicates zero-order, first-order, Higuchi, Hixson-crowell and Korsmeyer−Peppas rate constants respectively, Qt/Q0 means fraction of drug released at time t, K means rate constant and n means release exponent.
Statistical Analysis
Data were presented as mean ± standard deviation, calculated mathematical parameters using DDSolver (add-in for Microsoft Excel), analyzed statistically through one-way analysis of variance (ANOVA), followed by Dunnett’s t-test by using SPSS 24 for windows. The obtained results were compared with the reference drug. p<0.05 were considered as statistically significant.
Result & Discussion
The granulation process ensures that all tablets are similar in weight and have uniform drug content, since it is correlated to granules’ flow [14]. Table 5 shows the relative standard deviation (RSD) in weight variation, disintegration time and assay results for all the brands.
Table 5: Summary of quality attributes of Domperidone 10mg tablets
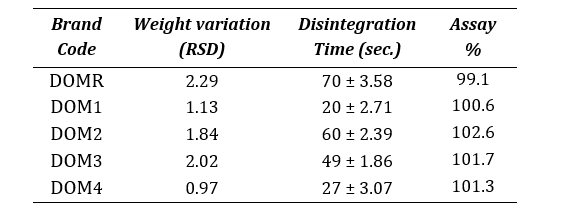
An average weight of twenty tablets of the different brands was found in the range of 139-190 mg. Apart from brand, the weight variation of all the other tablets were within the acceptable range (± 7.5% for tablets that weigh above 130mg) as described by USP , which indicates acceptable flow of the granules [23]. Drug content was found in the range of 99.1%-102.6% (95.0-105.0%). Disintegration times of all tablet formulations were within the acceptable limit. USP compounding compendium states that uncoated and plain-coated tablets should disintegrate within 30 minutes.
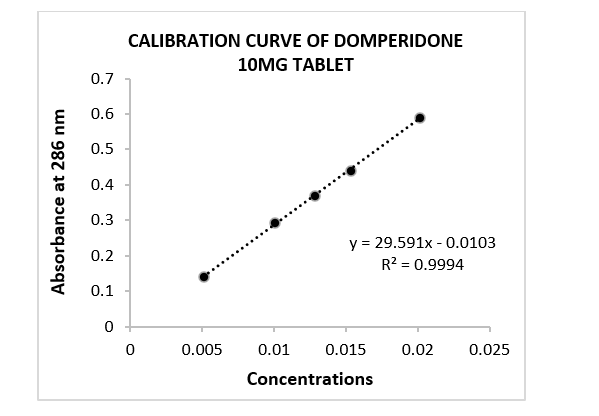
Figure 1: Calibration curve of domperidone 10mg tablet. Where, concentrations applied in mg/mL unit. Absorbance pattern was evaluated in linear regression.
Dissolution Profiles
According to USP, solid oral dosage forms should exhibit 85% dissolution in 60 minutes [24]. Figure 2 showed the result of the dissolution test of domperidone tablets were within the specification of pharmacopoeia. Almost all the brands released more than 85% of API within 15 minutes.
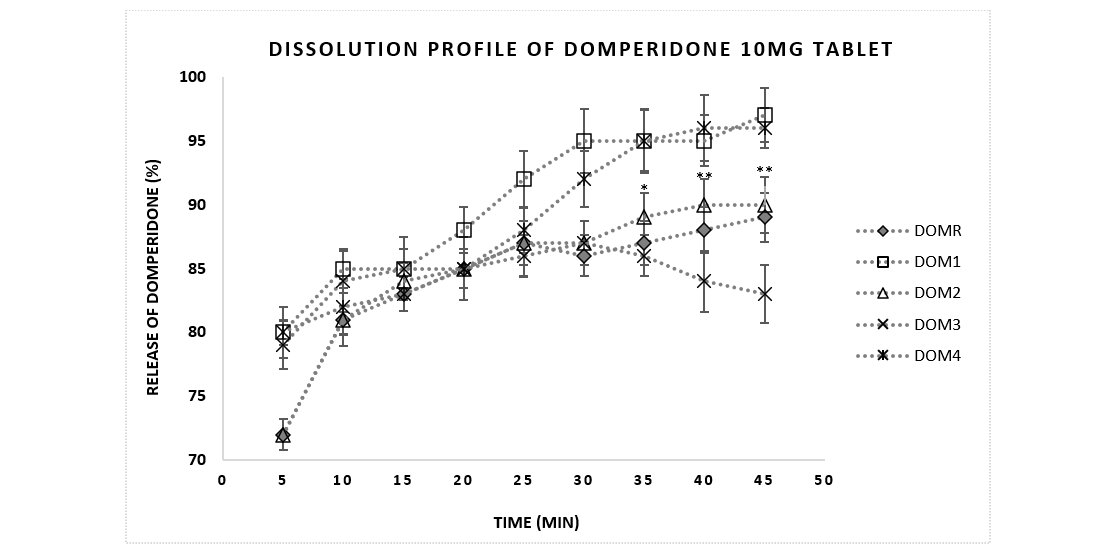
Figure 2: Comparative dissolution profile of Domperidone 10mg tablets between reference brand and sample products. Data were presented as mean ± standard error mean. Drug release profiles (% dissolution) of brands (DOM 1-4) (n=6) were analyzed in 5 minutes intervals up to 45 minutes and compared with the reference brand DOMR. *, ** means p<0.05, 0.01respectively.
Comparison of dissolution profiles by model-independent method
Dissolution is considered an important tool to predict in vivo bioavailability and has been used to prove bioequivalence to allow interchangeability. Very often USFDA considers dissolution testing to be more discriminating than an in vivo test. The difference factor (f1) is proportional to the percentage (%) difference between the two profiles at each time point and is a measurement of the relative error between the two curves, whereas the similarity factor (f2) is a logarithmic reciprocal square root transformation of the sum of squared error and is a measurement of the similarity between the two curves [25].
For curves to be considered similar, f1 values should be close to 0, and f2 values should be close to 100. Generally, f1 values up to 15 (0-15) and f2 values greater than 50 (50-100) ensure sameness or equivalence of the two curves and, thus, of the performance of the test (postchange) and reference (prechange) products [17,18]. If the f2 value was less than 50, then the dissolution profiles were considered significantly different [26]. Similarity test has been used frequently for in vitro bioequivalence studies by comparing the dissolution profiles of different brands of pharmaceutical dosage forms with the reference product. However, one disadvantage of this method is the dependency on the dissolution profile length. Nevertheless, USFDA has adopted it for in vitro dissolution release profile comparison. Since the value of f2 is greater than 50 for all brands, it can be concluded that these products show similar dissolution to that of reference brand. In comparison DOM2 showed highest f2 and lowest f1 values indicating best match with reference.
Table 6: Calculated difference factor (f1), similarity factor (f2), dissolution efficiency (DE) and mean dissolution time (MDT) for all Domperidone 10mg tablets.
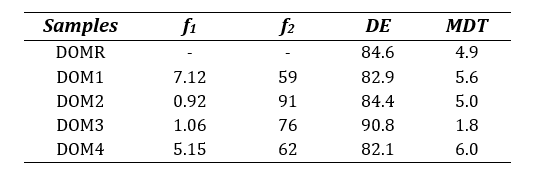
The similarity between the sample brands and reference brand were also assessed by studying DE and MDT where the sample products were considered similar if the obtained values fell within 10% variation (±) from the reference drug [17,27]. It can be observed from Table 6 that all four test brands closely met the requirement in DE and MDT outputs except for brand DOM3 which resulted in a lower MDT (1.8) than that of DOMR (4.9), indicating DOM3’s lower drug retaining ability of the polymer [28].
From the analysis of model-independent methods, it can be summarized that all the brands successfully met the equivalence criteria with the reference brand and thus can be considered interchangeably for prescribed use.
Table 7: Comparison of release profiles by R2, slope and AIC determination.
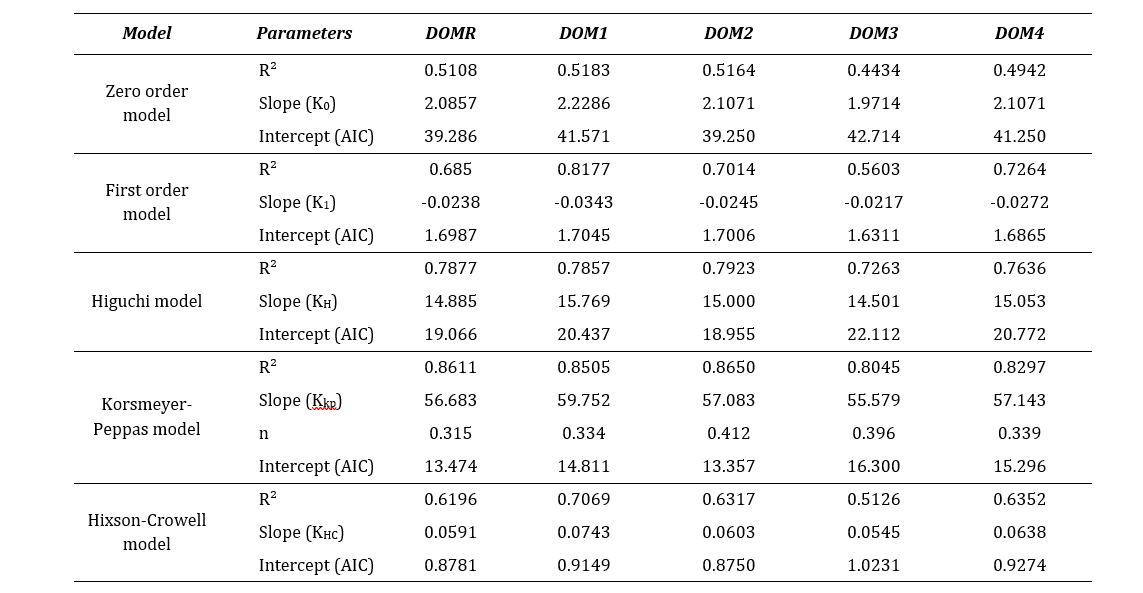
Where, r2 is regression coefficient, slope refers the release rate constant (K), n is the diffusion coefficient and intercept refer the Akaike Information Criteria (AIC).
Comparison of dissolution profiles by model-dependent method
From the assessment shown in Table 7, it was observed that all the test brands fitted well to the Korsmeyer-Peppas model. The best linearity was obtained in this model with highest r2 values which indicated that the drug release was diffusion controlled [7]. This model is generally of use in analyzing the release of pharmaceutical exponents, indicated for polymeric dosage forms in case the release pattern is not well known or multiple release phenomena is associated [29]. Moreover, the values of dissolution coefficient (n) were found below 0.45 for all brands which implied that the release pattern was predominantly Fickian diffusion (case I) [7]. However, considering the lowest AIC, all drugs also fitted to the Hixson-Crowell model. This model assumes that the release mechanism is mainly governed by the velocity of dissolution and less by the diffusion through the matrix [30]. Hixson-Crowell equation is used to interpret the dissolution data of dispersible or immediate release dosage formulations. Therefore, a higher correlation coefficient indicates that change in surface area and diameter of particles during the process of dissolution have an effect on drug release [31]. From the kinetic release analysis, it can be confirmed that all domperidone sample brands along with the reference brand demonstrated a similar release pattern.
The results obtained in this study indicate that all brands of Domperidone (10mg) tablets, complied with the USP specifications and can be considered equivalent to the reference product. It can be assumed that these dosage form may have similar bioavailability.
Conclusion
The results of this study clearly demonstrated that all the leading brands of domperidone selected from Bangladesh market comply with the criteria laid in the official monograph. Since dissolution test is a critical part of quality control so all pharmaceutical products must meet this quality parameter to be therapeutically effective. The data obtained in this study indicates that all sample brands can be considered bioequivalent with the reference market leader brand. However, further in vivo test is needed to support this statement.
Abbreviations
USP: United States Pharmacopoeia; BP: British Pharmacopoeia; DAR: Drug Administration Registration; USFDA: United States Food and Drug Administration; API: Active Pharmaceutical Ingredient; AIC: Akaike Information Criteria.
Acknowledgments
The present study was supported and carried out in the Research Lab of Institute for Pharmaceutical Skill Development and Research, Bangladesh. Authors are grateful to Mohammad Mustakim Billah, Department of Research, Institute for Pharmaceutical Skill Development and Research, Bangladesh, for providing all the technical support and coordination for the entire project.
Authors’ Contributions
This work was carried out in collaboration between all authors. Authors RRT designed, coordinated and supervised the project and also performed the statistical analysis. SH performed in vitro experiments and participated in acquisition of data. FA assisted in the experiments, drafted the manuscript. LJ provided technical support and assisted in the experiments. MAH developed the discussion and critically revised the manuscript
Competing Interests
All authors agreed on the article before submission and had no conflict of interests.
Funding
This research did not receive any specific grant from funding agencies in the public, commercial, or not-for-profit sectors. The study was carried out with individual funding of all authors.
Availability of Data and Materials
Datasets are available from the corresponding author on reasonable request.
Ethics Approval and Consent to Participate
This study was exempted for ethical clearance.
Consent for Publication
Not applicable.
References
- Bhatt S, Roy D, Kumar M, Saharan R, Malik A, Saini V. Development and Validation of In Vitro Discriminatory Dissolution Testing Method for Fast Dispersible Tablets of BCS Class II Drug. Turk J Pharm Sci. 2020;17(1):74-80. DOI PubMed PMC Google Scholar
- Zaborenko N, Shi Z, Corredor CC, et al. First-Principles and Empirical Approaches to Predicting In Vitro Dissolution for Pharmaceutical Formulation and Process Development and for Product Release Testing. AAPS J. 2019;21(3):32. DOI PubMed PMC Google Scholar Link
- Waiver of in vivo bioavailability and bioequivalence studies for immediate-release solid oral dosage forms based on a biopharmaceutics classification system - Digital Collections - National Library of Medicine. Accessed August 18, 2021. Link
- Enteshari S, Varshosaz J. Solubility Enhancement of Domperidone by Solvent Change In situ Micronization Technique. Adv Biomed Res. 2018;7: 109. DOI PubMed PMC Google Scholar Link
- Mucklow JC. Martindale: The Complete Drug Reference. Br J Clin Pharmacol. 2000;49(6):613. DOI PMC Google Scholar Link
- Tripathi K. D. Essential of Medical Pharmacology. New Delhi, India: Jaypee brothers medical Publisher Ltd. (2008), pp. 639. Google Scholar Link
- Arora G, Malik K, Singh I. Formulation and evaluation of mucoadhesive matrix tablets of taro gum: optimization using response surface methodology. Polim Med. 2011;41(2):23-34. PubMed Google Scholar Link
- Domperidone170305singlespace.pdf. Accessed Aug 18, 2021. Link
- Prajapati ST, Patel LD, Patel DM. Studies on Formulation and In Vitro Evaluation of Floating Matrix Tablets of Domperidone. Indian J Pharm Sci. 2009;71(1):19-23. DOI PubMed PMC Google Scholar Link
- General Chapters: <711> DISSOLUTION. Accessed June 21, 2021, Link
- International Conference on Harmonisation of Technical Requirements for Registration of Pharmaceuticals for Human Use in: Handbook of Transnational Economic Governance Regimes. Accessed August 18, 2021. Link
- Patra S, Sahoo R, Panda RK, Himasankar K, Barik BB. In vitro evaluation of domperidone mouth dissolving tablets. Indian J Pharm Sci. 2010;72(6):822-825. DOI PubMed PMC Google Scholar Link
- Uddin MS, Mamun AA, Hossain MS, et al. In vitro quality evaluation of leading brands of ciprofloxacin tablets available in Bangladesh. BMC Res Notes. 2017;10(1):185. DOI PubMed PMC Google Scholar Link
- Dulla O, Sultana S, Shohag Hosen M. In vitro comparative quality evaluation of different brands of esomeprazole tablets available in selected community pharmacies in Dhaka, Bangladesh. BMC Res Notes. 2018;11(1):184. DOI PubMed PMC Google Scholar Link
- Kassaye L, Genete G. Evaluation and comparison of in-vitro dissolution profiles for different brands of amoxicillin capsules. Afr Health Sci. 2013;13(2):369-375. DOI PubMed PMC Google Scholar Link
- Polli JE, Rekhi GS, Augsburger LL, Shah VP. Methods to compare dissolution profiles and a rationale for wide dissolution specifications for metoprolol tartrate tablets. J Pharm Sci. 1997;86(6):690-700. DOI PubMed Google Scholar Link
- Anderson NH, Bauer M, Boussac N, Khan-Malek R, Munden P, Sardaro M. An evaluation of fit factors and dissolution efficiency for the comparison of in vitro dissolution profiles. J Pharm Biomed Anal. 1998;17(4-5):811-822. DOI PubMed Google Scholar Link
- Ngwuluka NC, Lawal K, Olorunfemi PO, Ochekpe NA. Post-market in vitro bioequivalence study of six brands of ciprofloxacin tablets/caplets in Jos, Nigeria. Sci Res Essays.:8. Google Scholar Link
- Rinaki E, Dokoumetzidis A, Macheras P. The mean dissolution time depends on the dose/solubility ratio. Pharm Res. 2003;20(3):406-408. DOI PubMed Google Scholar Link
- Siepmann J, Peppas NA. Modeling of drug release from delivery systems based on hydroxypropyl methylcellulose (HPMC). Advanced Drug Delivery Reviews. 2001;48(2):139-157. DOI PubMed Google Scholar Link
- Bruschi ML, ed. 5 - Mathematical models of drug release. In: Strategies to Modify the Drug Release from Pharmaceutical Systems. Woodhead Publishing; 2015:63-86. DOI Google Scholar Link
- Parezanović, G. Š.; Lalić-Popović, M.; Goločorbin-Kon, S.; Todorović, N.; Pavlović, N.; Mikov, M. In vitro comparative quality evaluation of non-expired and 10 years-expired lamotrigine immediate-release tablet formulations – pilot study. Dissolut. Technol. 2020, 27, 14–20. DOI Google Scholar Link
- H Aodah A, H Fayed M, Alalaiwe A, B Alsulays B, F Aldawsari M, Khafagy ES. Design, Optimization, and Correlation of In Vitro/In Vivo Disintegration of Novel Fast Orally Disintegrating Tablet of High Dose Metformin Hydrochloride Using Moisture Activated Dry Granulation Process and Quality by Design Approach. Pharmaceutics. 2020;12(7):598. Published 2020 Jun 27. DOI PubMed PMC Google Scholar Link
- Skwierczynski R, Curry P, Gray V, et al. Revision of the Dissolution Procedure: Development and Validation. Dissolution Technol. 2014;21(1):6-8. DOI Google Scholar Link
- Abebe S, Ketema G, Kassahun H. In vitro Comparative Quality Assessment of Different Brands of Furosemide Tablets Marketed in Northwest Ethiopia. Drug Des Devel Ther. 2020;14:5119-5128. DOI PubMed PMC Google Scholar Link
- Hamed R, Awadallah A, Sunoqrot S, et al. pH-Dependent Solubility and Dissolution Behavior of Carvedilol--Case Example of a Weakly Basic BCS Class II Drug. AAPS PharmSciTech. 2016;17(2):418-426. DOI PubMed PMC Google Scholar Link
- Shuma ML, Jahan A, Halder S. Assessment of Drug Release Kinetics and Quality of Naproxen Generic Tablets in Bangladesh. Dissolution Technol. 2021;28(2):30-35. DOI Google Scholar Link
- Hossain A, Alam S, Paul P. Development and Evaluation of Sustained Release Matrix Tablets of Indapamide using Methocel K15M CR. Journal of Applied Pharmaceutical Science.:6. Google Scholar Link
- Mohapatra S. Goodness of fit Model Dependent Approaches of Controlled Release Matrix Tablets of Zidovudine. Indian Journal of Pharmaceutical Education and Research. 2016;50(1):138-145. DOI Google Scholar Link
- Craciun A-M, Barhalescu ML, Agop M, Ochiuz L. Theoretical Modeling of Long-Time Drug Release from Nitrosalicyl-Imine-Chitosan Hydrogels through Multifractal Logistic Type Laws. Comput Math Methods Med. 2019;2019:4091464. DOI PubMed PMC Google Scholar Link
- Gouda R, Baishya H, Qing Z. Application of Mathematical Models in Drug Release Kinetics of Carbidopa and Levodopa ER Tablets. J Develop Drugs 2017,6:2. DOI Google Scholar Link
Update History
| Revision Number | Date | Details Of Changes |
|---|---|---|
| 01 | 2021-08-27 | Original Article; published at its accepted version (Reference Number: PPD/MIN/2181A) |
| 2 | 2026-05-16 | Crossref DOI assignment |