- Tamanna NE 1

- Khengari EM 1
- Published On: 2026-05-09|
- DOI Link :
 |
| - Download: |
- Article Information |
- Article Metadata |
- Share
- Received On: 2025-12-18|
- Accepted On: 2026-04-23|
- Published On: 2026-05-09
| Article Metadata | |||
|---|---|---|---|
| 1 | Submitted Manuscript | PPD/MIN/251218/1 | |
| 2 | Cover Letter to Editor | PPD/CLE/251218/1 | |
| 3 | Copyright Transfer Letter | PPD/CTL/251218/1 | |
| 4 | Authors’ Consent Letter | PPD/ACL/251218/1 | |
| 5 | Initial Editorial Screening Report | PPD/IESR/251218/1 | |
| 6 | Review Agreement Letter (Reviewer 1) | PPD/RAL/251218/R1 | |
| 7 | Review Agreement Letter (Reviewer 2) | PPD/RAL/251218/R2 | |
| 8 | Manuscript Review Report (Round 1, Reviewer 1) | PPD/MRR/251218/R1.R1 | |
| 9 | Manuscript Review Report (Round 1, Reviewer 2) | PPD/MRR/251218/R1.R2 | |
| 10 | Revised Manuscript | PPD/RMIN/251218/1 | |
| 11 | Review Response Letter (Round 1) | PPD/RRL/251218/R1 | |
| 12 | Manuscript Review Report (Round 2, Reviewer 1) | PPD/MRR/251218/R2.R1 | |
| 13 | Manuscript Review Report (Round 2, Reviewer 2) | PPD/MRR/251218/R2.R2 | |
| 14 | Final Editorial Screening Report | PPD/FESR/251218/1 | |
| 15 | Letter of Acceptance and Acknowledgement | PPD/LAA/251218/1 | |
| 16 | Accepted Manuscript | PPD/AMIN/251218/1 | |
| Request Access | |||
| Supplementary Data | ||
|---|---|---|
| The datasets used and/or analyzed during the study are available from the corresponding author on reasonable request. | ||
| EnvChemMetaFlow_Uploadable_Supplementary_Code_Package.zip | Request Access | |
Abstract
Background: Environmental chemical research increasingly relies on heterogeneous datasets derived from environmental monitoring studies, analytical chemistry reports, and systematic reviews. However, inconsistencies in reporting formats, concentration units, metadata quality, and analytical methodologies often limit reproducibility and quantitative evidence synthesis. This study introduces EnvChemMetaFlow, a standardized workflow for environmental chemical data management and meta-analysis using synthetic demonstration datasets.
Methods: Synthetic datasets representing pharmaceutical residues, antibiotics, and nitrate contamination in aquatic systems across selected Asian countries were generated to demonstrate the workflow. The framework incorporated structured data extraction, unit harmonization, random-effects meta-analysis, subgroup analysis, meta-regression, publication-bias assessment, and reproducible visualization within an R-based computational pipeline.
Results: The workflow successfully integrated environmental data organization, statistical synthesis, and publication-ready visualization within a reproducible analytical framework. Random-effects meta-analysis demonstrated substantial heterogeneity among the synthetic datasets, while subgroup analyses and meta-regression illustrated the applicability of the workflow for evaluating environmental moderators and pollutant variability.
Conclusion: EnvChemMetaFlow provides a standardized and reproducible framework for environmental chemical data management and evidence synthesis. The workflow may support graduate-level training, interdisciplinary environmental management education, and computational reproducibility in environmental chemistry research.
Introduction
Environmental pollution associated with industrialization, pharmaceutical discharge, agricultural intensification, chemical manufacturing, and urbanization has become an increasingly important global concern. Environmental contaminants such as nitrate compounds, antibiotics, antidepressants, pesticides, heavy metals, and emerging micropollutants are now frequently detected in groundwater, surface water, wastewater systems, sediments, and agricultural environments [1-5]. Consequently, environmental monitoring studies have generated large volumes of chemical concentration data originating from diverse geographical regions and environmental matrices [6-9].
Despite the rapid expansion of environmental monitoring literature, integration and synthesis of environmental chemical datasets remain challenging. Environmental chemistry studies frequently differ in reporting structure, concentration units, metadata completeness, analytical methodology, and statistical presentation. Concentrations may be reported using inconsistent units such as ng/L, µg/L, mg/L, ppm, or mg/kg, whereas metadata regarding sampling location, instrumentation, analytical procedures, and environmental conditions may be incomplete or inconsistently documented [10,11]. Furthermore, essential statistical descriptors such as sample size, standard deviation, or confidence intervals are often absent, thereby limiting reproducibility and quantitative evidence synthesis.
Systematic review and meta-analysis have become increasingly important tools for integrating environmental evidence and evaluating pollutant distributions across heterogeneous studies. However, many environmental researchers, particularly graduate students and interdisciplinary investigators from management or non-computational backgrounds, encounter substantial barriers in organizing datasets, harmonizing environmental variables, conducting reproducible analyses, and generating publication-ready outputs. Simultaneously, modern scientific research increasingly emphasizes reproducibility, open science, FAIR data principles, and transparent computational workflows. FAIR principles encourage scientific datasets that are Findable, Accessible, Interoperable, and Reusable [12]. Reproducible computational workflows are now considered essential components of modern environmental research and evidence synthesis.
Although several studies have independently discussed environmental systematic review methodology or statistical meta-analysis approaches, relatively few studies provide an integrated end-to-end workflow specifically designed for environmental chemical data management and evidence synthesis. Therefore, the present study introduces EnvChemMetaFlow, a standardized and reproducible workflow designed for environmental chemical meta-analysis and data management. The framework uses synthetic demonstration datasets to validate and illustrate the workflow without generating artificial environmental conclusions. The primary purpose of the study is methodological demonstration rather than environmental inference.
The proposed workflow integrates systematic literature organization, structured environmental chemical data extraction, unit harmonization, quality assessment, statistical meta-analysis, subgroup analysis, meta-regression, visualization, and reproducible reporting within a unified computational framework. By integrating these components into a standardized analytical pipeline, the framework enables efficient management, synthesis, and interpretation of heterogeneous environmental datasets while maintaining methodological transparency and computational reproducibility. A schematic overview of the proposed workflow architecture is presented in Figure 1.
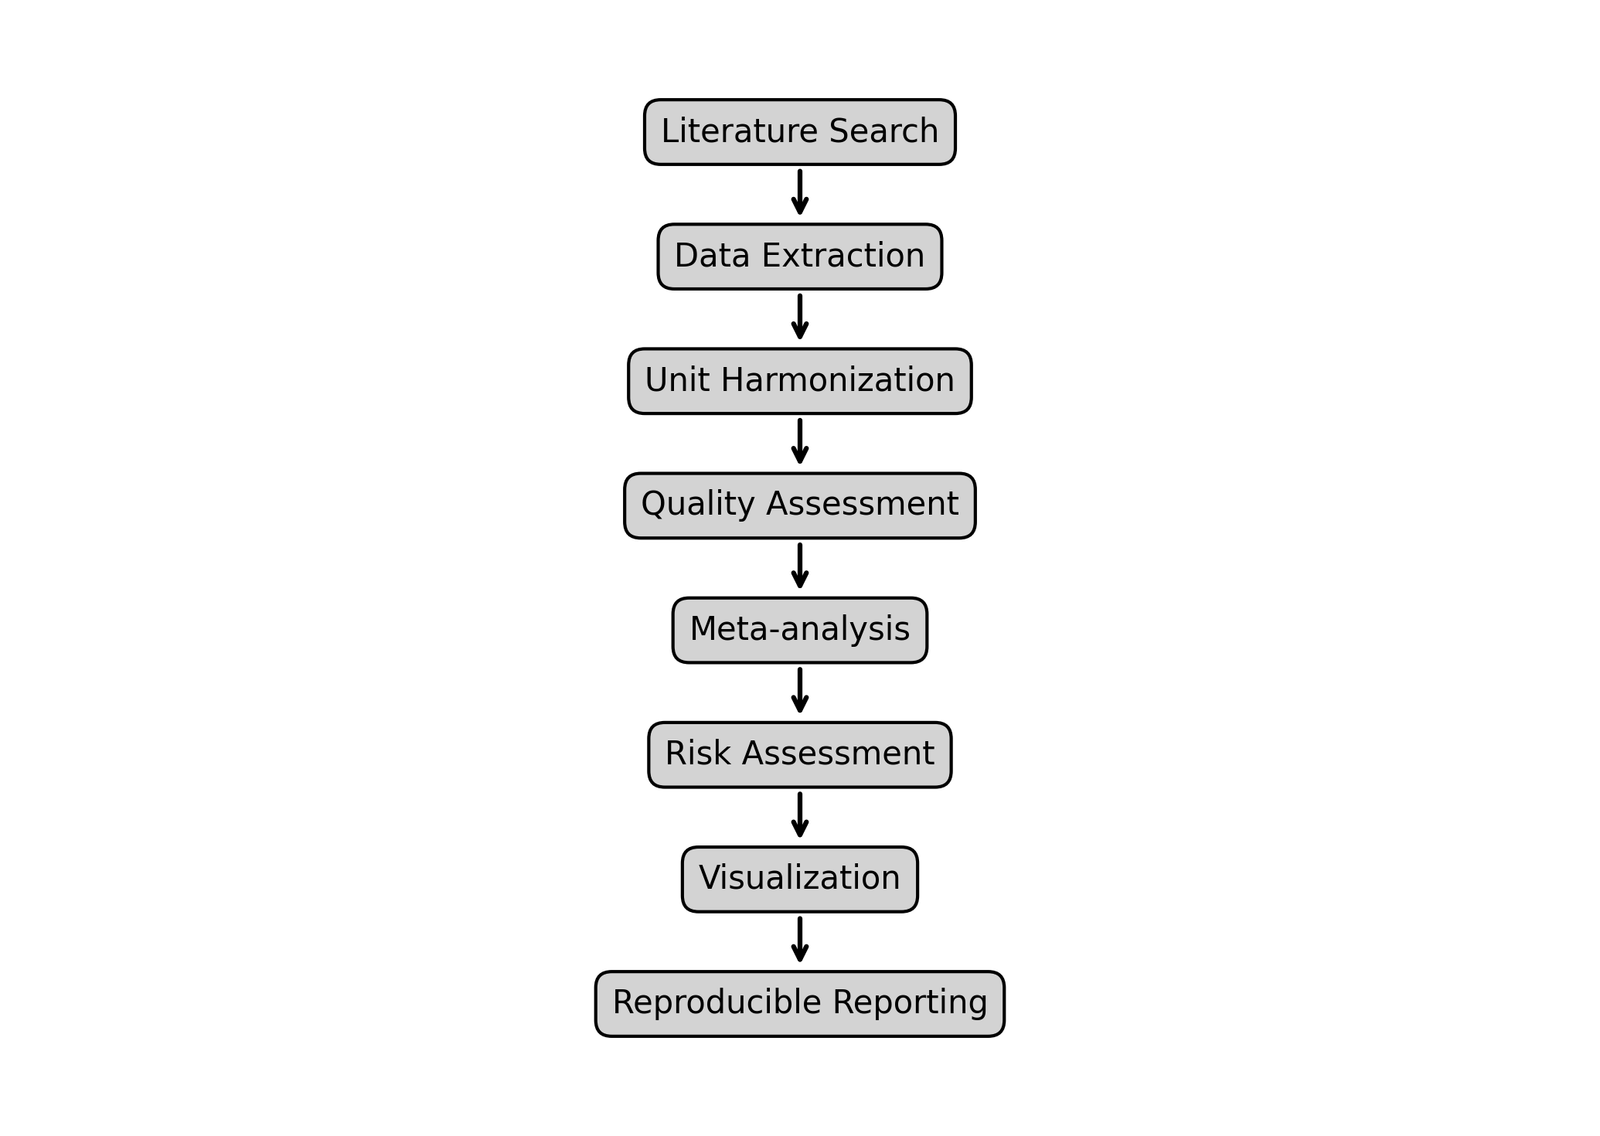
Figure 1. Schematic overview of the EnvChemMetaFlow workflow.
In addition to its analytical functionality, the framework was designed to support broader educational and interdisciplinary research applications. The workflow may serve as a valuable resource for graduate-level training in environmental chemistry and environmental management, particularly for interdisciplinary researchers from computational, management, or non-laboratory backgrounds. Furthermore, the script-based implementation promotes computational reproducibility and methodological standardization while facilitating transparent reporting practices aligned with FAIR principles and open-science initiatives.
Methods
Conceptual Framework
The EnvChemMetaFlow workflow was designed to integrate principles of environmental chemistry with reproducible data-science methodology, with particular emphasis on transparency, modularity, interoperability, and computational reproducibility. The framework incorporates systematic literature organization, structured environmental chemical data extraction, metadata harmonization, unit standardization, quality assessment, statistical synthesis, visualization, and reproducible reporting within a unified analytical architecture.
The workflow architecture was intentionally developed to remain adaptable across multiple classes of environmental contaminants, including pharmaceutical residues, antibiotics, nitrate contamination, heavy metals, pesticides, and emerging pollutants. This flexibility allows the framework to be applied across diverse environmental matrices such as groundwater, wastewater, agricultural systems, sediments, and surface-water environments.
Analytical Modules
The EnvChemMetaFlow framework was organized into interconnected analytical modules designed to support standardized environmental chemical data management and reproducible evidence-synthesis workflows.
Literature Identification and Screening
The first module focused on literature identification and systematic screening. Environmental studies were theoretically retrieved from major scientific databases including PubMed, Scopus, Web of Science, ScienceDirect, and Google Scholar using predefined search terms associated with groundwater contamination, pharmaceutical residues, antibiotic occurrence, nitrate accumulation, and environmental monitoring. PRISMA-compatible screening procedures were incorporated to improve workflow transparency and reproducibility during study selection [13]. However, the PRISMA-style workflow diagram generated in the present study was used exclusively for methodological demonstration and does not represent a real systematic review process. The methodological screening structure used in the workflow demonstration is illustrated in Figure 2.
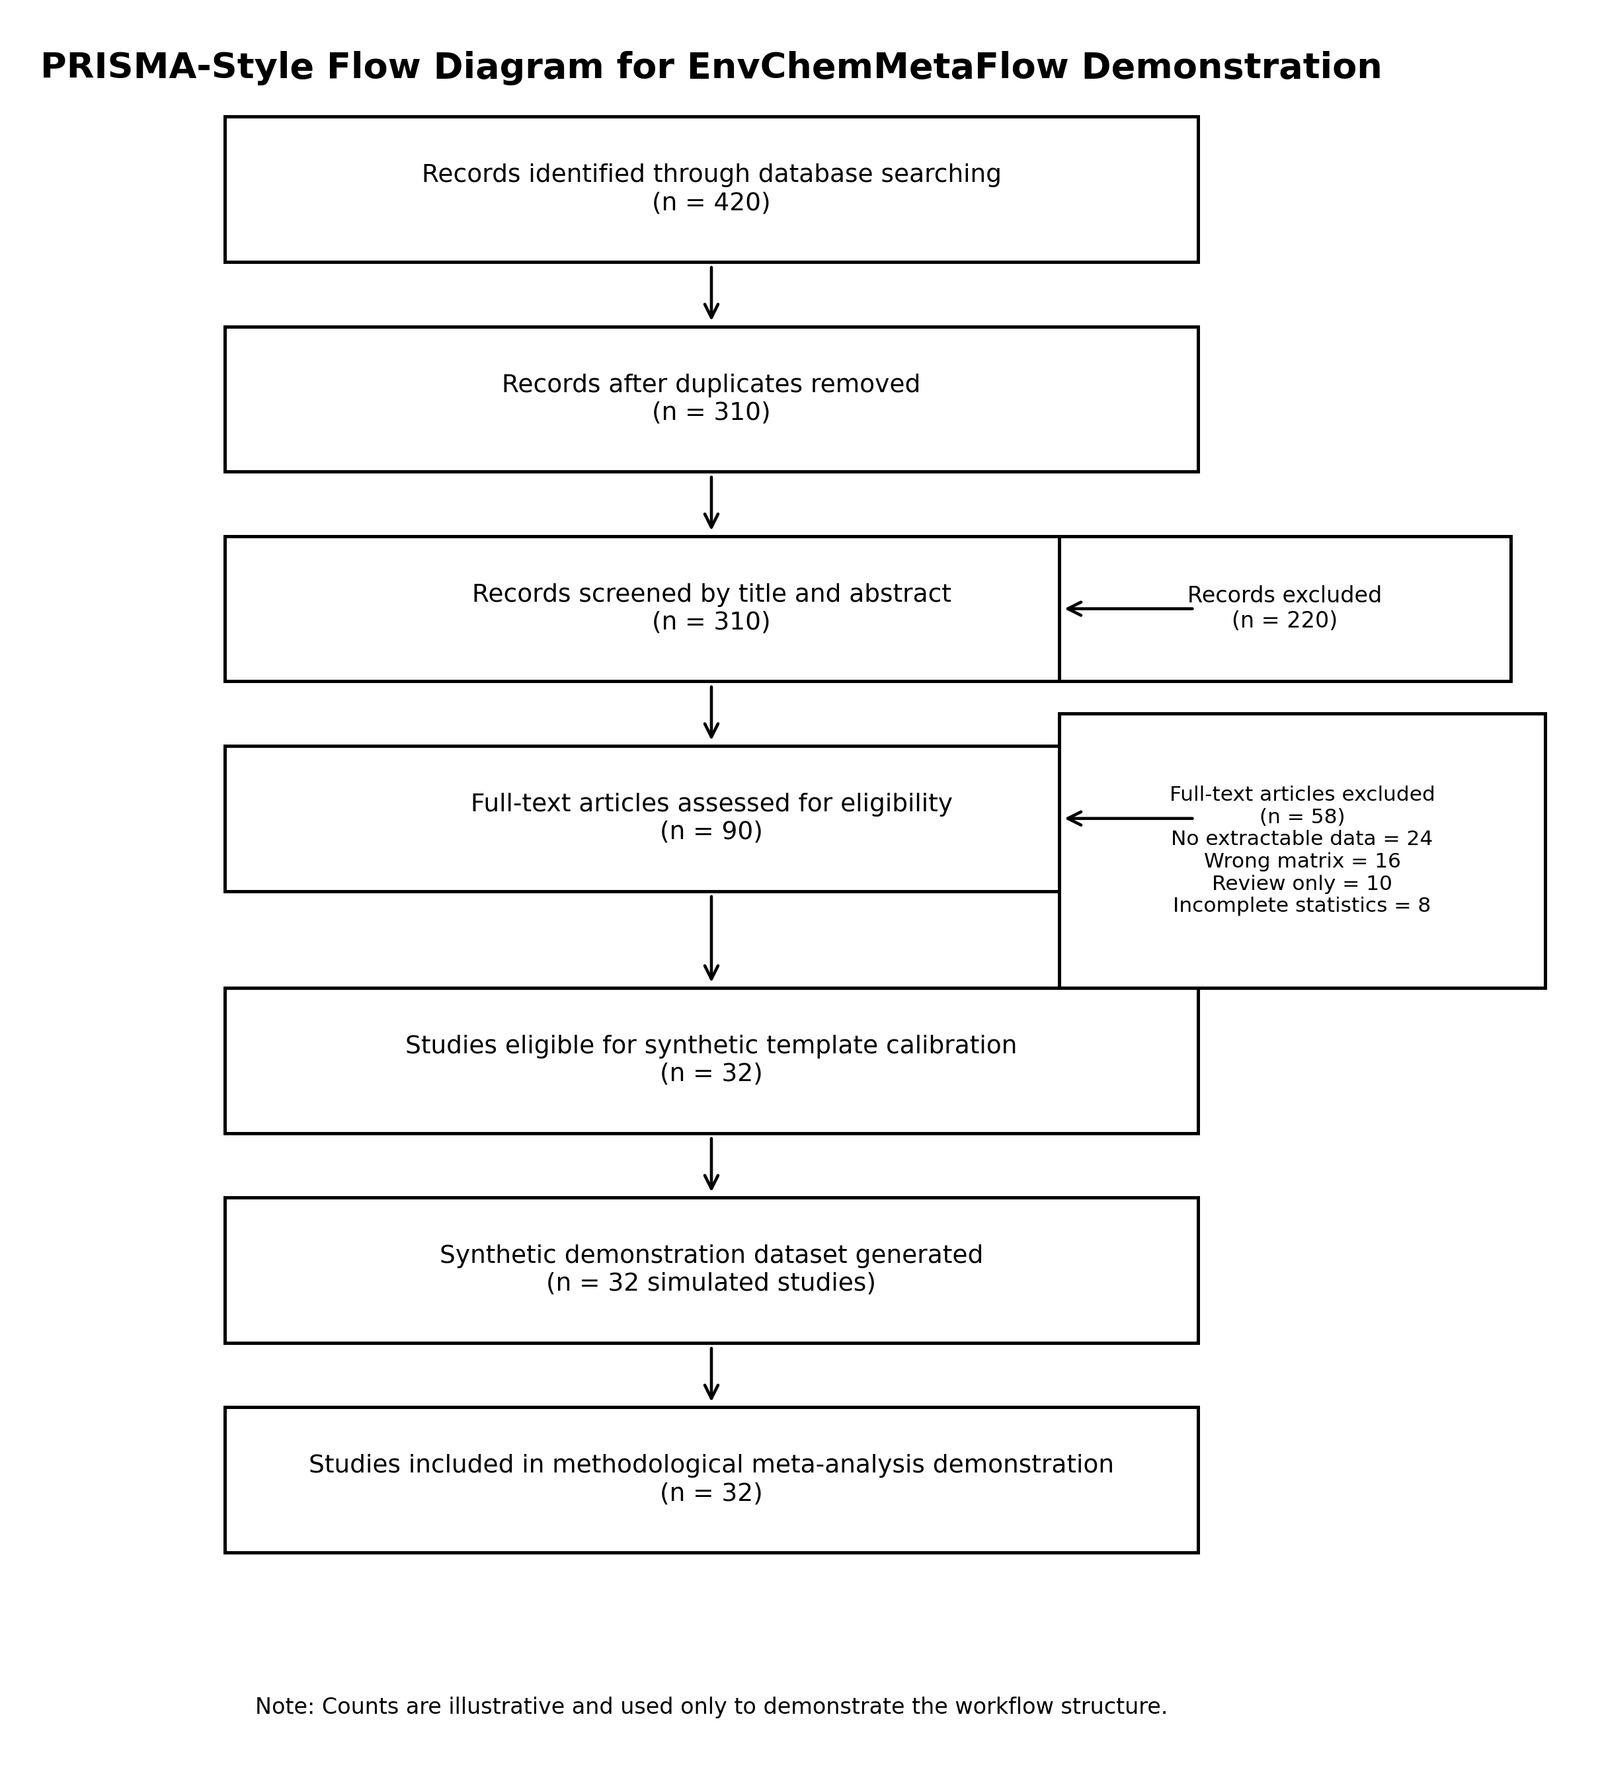
Figure 2. PRISMA-style workflow diagram generated for methodological demonstration.
Structured Environmental Chemical Data Extraction
The second module consisted of structured environmental chemical data extraction. Environmental monitoring variables were organized into standardized spreadsheet templates containing study identifiers, sampling location, environmental matrix, compound name, concentration value, analytical method, sample size, and statistical descriptors.
Unit Harmonization
The third module addressed unit harmonization, which represents one of the major technical challenges in environmental meta-analysis. Concentration values reported in different units, including µg/L, mg/L, ng/L, and ppm, were standardized using scripted transformation procedures. Automated harmonization minimized manual conversion errors and improved comparability among heterogeneous environmental datasets [14].
Quality Assessment
The fourth module incorporated a structured quality-assessment framework. Each study was theoretically evaluated according to predefined criteria including reporting of sample size, standard deviation, analytical instrumentation, sampling location, and quality-control procedures.
Synthetic Dataset Generation
The fifth module involved synthetic dataset generation for methodological demonstration and workflow validation. Synthetic environmental datasets representing pharmaceutical residues, antibiotic occurrence, and nitrate contamination were generated within environmentally plausible concentration ranges derived from published environmental monitoring literature. The synthetic datasets were explicitly labeled as demonstration-only data and were not intended to represent real environmental contamination levels.
Statistical Meta-analysis
The sixth module implemented statistical meta-analysis using random-effects models to account for substantial heterogeneity commonly observed among environmental monitoring datasets. Analytical outputs included pooled log-transformed concentration estimates, forest plots, funnel plots, subgroup analyses, meta-regression models, and heterogeneity assessment. The workflow was implemented in the R statistical environment using packages including metafor, meta, ggplot2, dplyr, readr, and openxlsx [16-20].
Visualization and Reproducible Reporting
The final module focused on reproducible reporting and visualization. The workflow generated publication-ready forest plots, funnel plots, subgroup analyses, meta-regression visualizations, spreadsheet outputs, and reproducible script-based analytical reports. All analytical procedures were conducted through script-based implementations to maximize transparency, reproducibility, and computational standardization throughout the workflow [21].
Statistical Analysis
Statistical analyses were performed using random-effects meta-analysis models implemented with restricted maximum likelihood (REML) estimation to account for substantial heterogeneity commonly observed among environmental monitoring studies [22]. Log transformation was applied to concentration values to accommodate the large scale differences among pollutant categories, particularly between nitrate compounds and pharmaceutical micropollutants. Between-study heterogeneity was evaluated using multiple complementary statistical indicators including Cochran’s Q statistic, Tau², and the I² statistic [23-24]. The I² statistic was used to estimate the proportion of total variability attributable to true heterogeneity rather than sampling error.
Subgroup analyses were subsequently conducted according to environmental matrix, pollutant class, and geographical category. Meta-regression analyses were additionally performed to evaluate potential moderator variables contributing to between-study heterogeneity. Publication bias and small-study effects were evaluated through visual inspection of funnel-plot symmetry combined with Egger’s regression analysis [25].
Demonstration Dataset Construction
Synthetic Dataset Construction
To validate the analytical functionality of the proposed EnvChemMetaFlow workflow, a synthetic environmental monitoring dataset was generated representing pharmaceutical residues, nitrate contamination, and antibiotic occurrence in aquatic systems across selected Asian countries. The synthetic dataset consisted of 32 simulated environmental monitoring studies representing groundwater, wastewater, and surface-water systems from Bangladesh, India, China, Pakistan, Vietnam, and Thailand. Simulated compounds included Fluoxetine, Ciprofloxacin, nitrate compounds, and mixed pharmaceutical residues. Environmental concentration values were randomly generated within environmentally plausible ranges derived from previously published environmental monitoring studies. Concentration distributions were intentionally varied to simulate realistic between-study heterogeneity commonly encountered in environmental pollutant research. Additional variables incorporated into the dataset included sample size, standard deviation, sampling year, analytical detection method, and environmental matrix type.
The final synthetic dataset included 32 simulated studies encompassing six Asian countries, four pollutant classes, and three environmental matrices. Sample sizes ranged from 15 to 80 observations per study. The generated datasets were explicitly labeled as demonstration-only data and were used exclusively for methodological validation and workflow demonstration rather than environmental inference. The structure of the synthetic environmental dataset is summarized in Table 1.
Table 1. Structure of the Synthetic Demonstration Dataset
Study ID | Country | Compound | Water Type | Mean Concentration (ng/L) | SD | Sample Size |
S1 | Bangladesh | Fluoxetine | Groundwater | 42.15 | 10.82 | 20 |
S2 | India | Ciprofloxacin | Wastewater | 128.44 | 31.77 | 25 |
S3 | China | Nitrate | Surface Water | 4812.33 | 522.1 | 30 |
S4 | Pakistan | Fluoxetine | Groundwater | 57.62 | 13.55 | 18 |
S5 | Vietnam | Mixed Pharmaceuticals | Wastewater | 212.47 | 61.82 | 40 |
Results
Overview of the Synthetic Demonstration Dataset
The synthetic environmental monitoring dataset represented a heterogeneous environmental surveillance framework involving multiple pollutant classes, environmental matrices, and geographical regions. Simulated concentration values varied substantially among pollutant categories, with nitrate compounds demonstrating comparatively higher concentration ranges, whereas antidepressant compounds exhibited lower environmental concentrations consistent with pharmaceutical micropollutant profiles.
Descriptive statistical analysis demonstrated broad variability across simulated studies, thereby reflecting realistic environmental heterogeneity commonly encountered in environmental chemistry research. Wastewater-associated datasets generally exhibited higher concentration distributions compared with groundwater datasets, whereas pharmaceutical residues demonstrated narrower concentration intervals relative to nitrate contamination datasets. Summary statistics of the synthetic environmental dataset are presented in Table 2.
Table 2. Summary Statistics of the Synthetic Environmental Dataset
| Pollutant Class | Mean (ng/L) | Median (ng/L) | Minimum | Maximum |
| Fluoxetine | 48.36 | 44.21 | 15.32 | 109.44 |
| Ciprofloxacin | 132.58 | 121.16 | 45.21 | 281.75 |
| Nitrate | 4215.74 | 3922.18 | 1510.42 | 7628.39 |
| Mixed Pharmaceuticals | 184.92 | 171.47 | 60.15 | 342.81 |
Meta-analysis Demonstration
Random-effects meta-analysis generated pooled log-transformed concentration estimates for the synthetic environmental datasets. Substantial between-study heterogeneity was observed across the simulated environmental monitoring studies, consistent with variability typically reported in environmental pollutant literature. The forest plot generated by the EnvChemMetaFlow workflow demonstrated variability among pollutant concentration estimates while simultaneously visualizing pooled random-effects estimates and associated confidence intervals. Simulated wastewater studies generally demonstrated higher concentration estimates compared with groundwater datasets, whereas nitrate datasets exhibited substantially larger concentration distributions than pharmaceutical micropollutants. The overall random-effects model demonstrated substantial heterogeneity among included synthetic studies (I² > 90%), thereby supporting the use of random-effects statistical modeling. The random-effects forest plot generated from the synthetic dataset is presented in Figure 3.
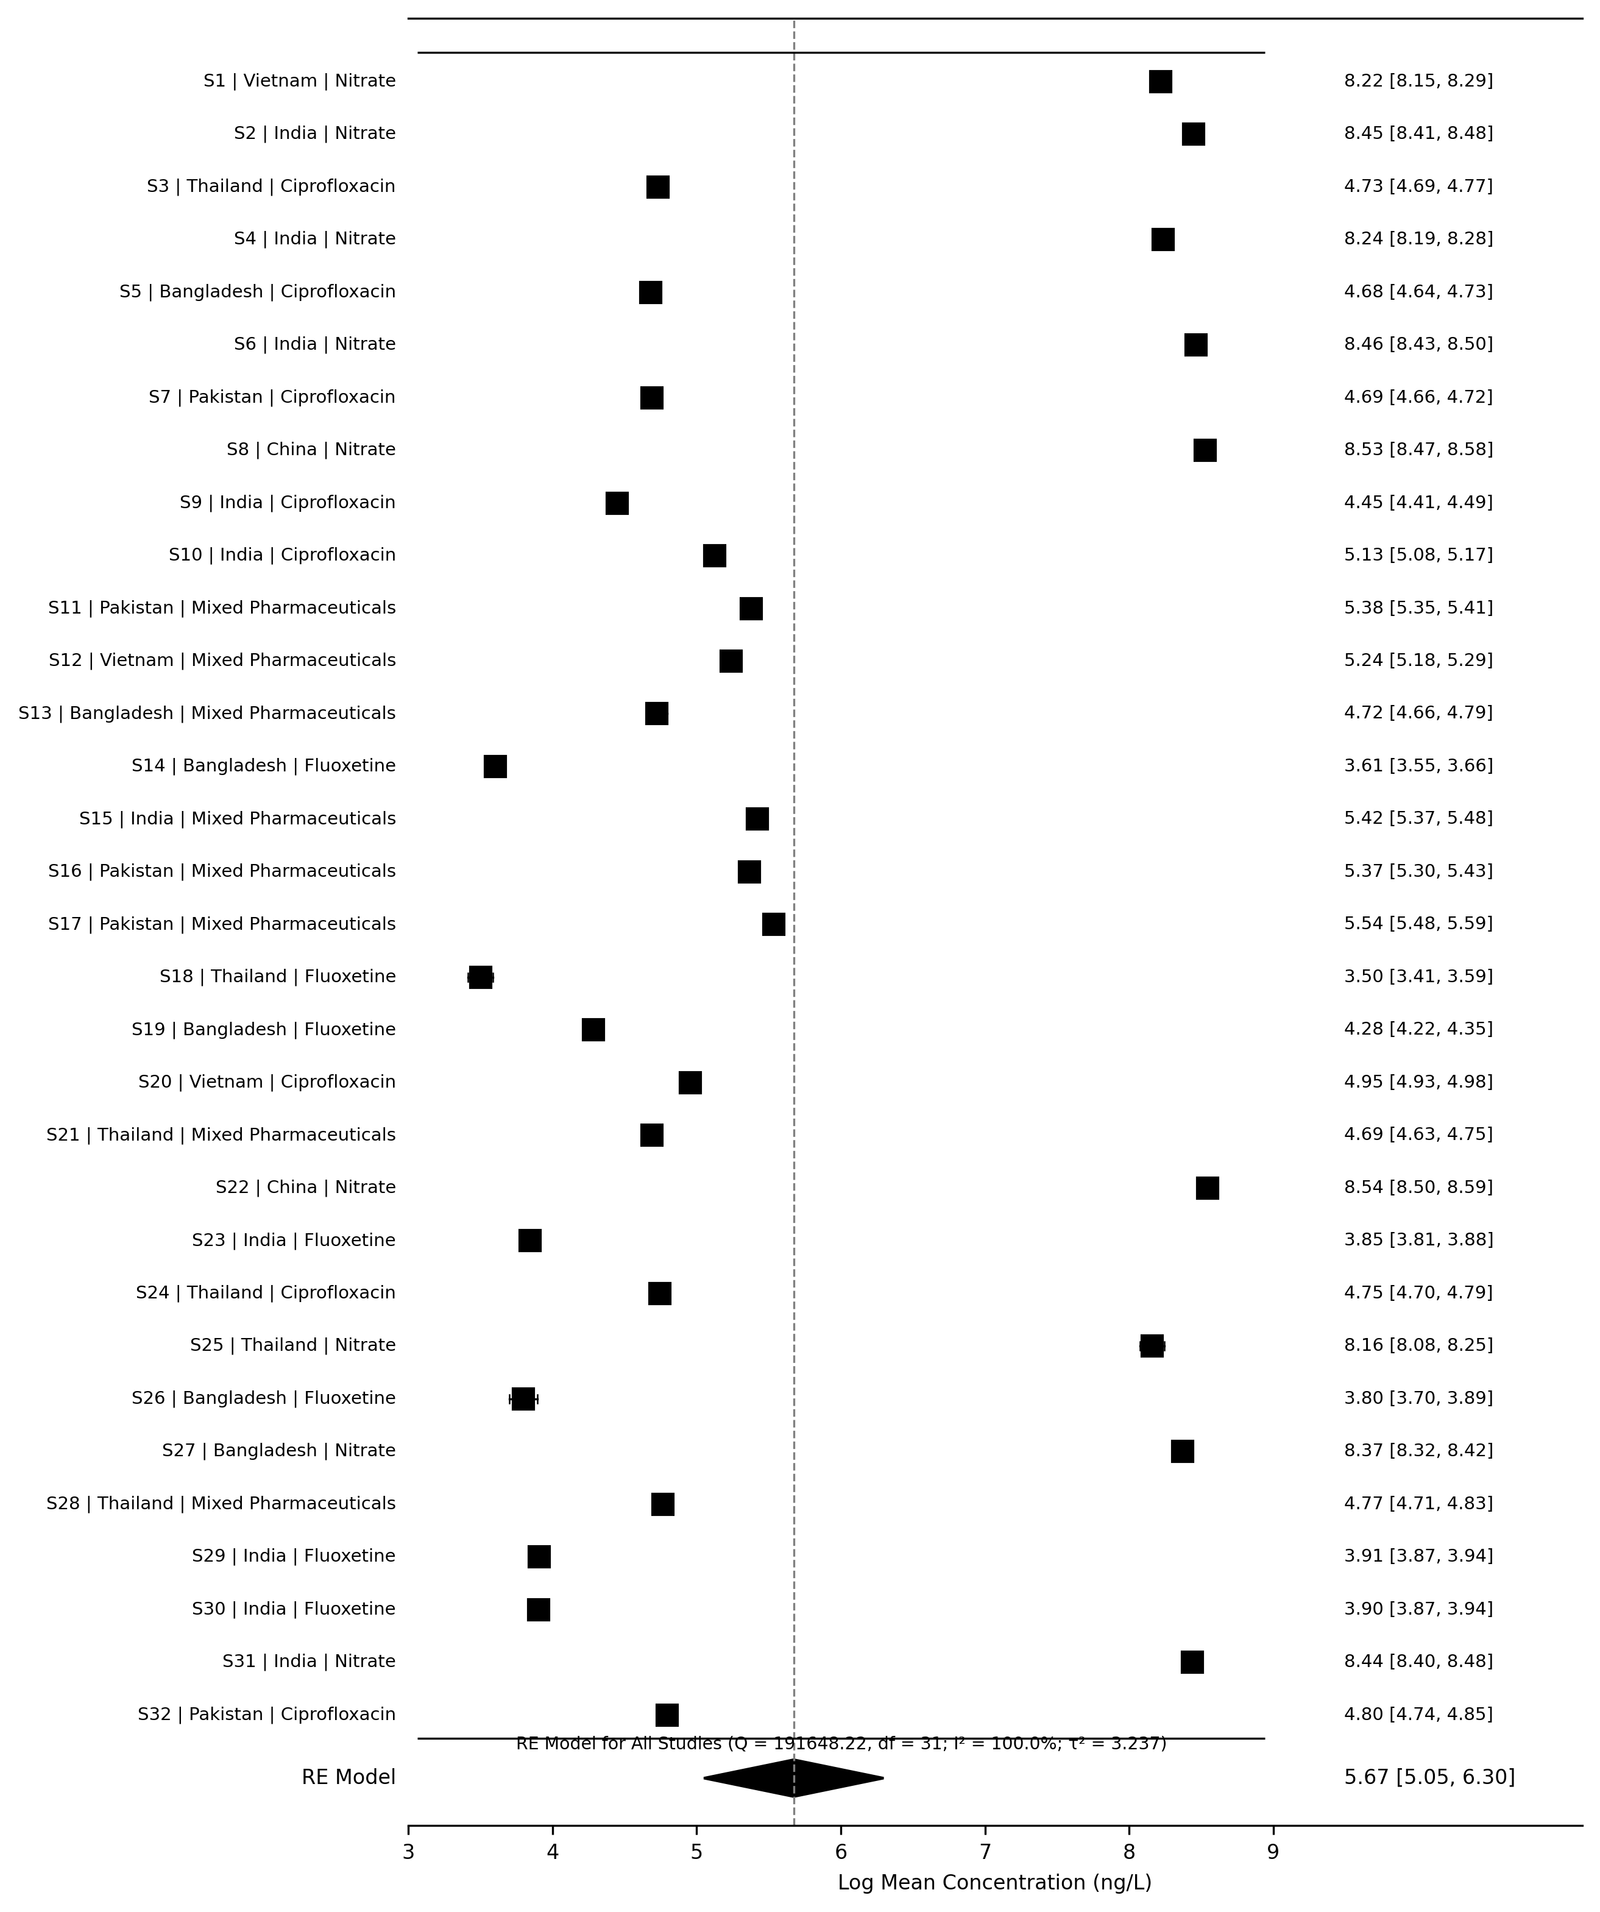
Figure 3. Synthetic Demonstration Forest Plot
The forest plot demonstrated substantial variability among simulated pollutant concentration estimates across environmental matrices. The pooled random-effects estimate indicated broad concentration dispersion consistent with heterogeneous environmental monitoring conditions and varying pollutant classes.
Publication Bias Assessment
Visual inspection of the funnel plot demonstrated mild asymmetry among the simulated environmental studies. However, because the dataset was synthetically generated for methodological validation rather than environmental inference, the observed asymmetry primarily reflected intentionally simulated heterogeneity rather than true publication bias. Egger’s regression analysis demonstrated no statistically significant small-study effect within the synthetic demonstration dataset (p > 0.05). These findings suggest that the analytical workflow successfully incorporated publication-bias assessment procedures within the standardized computational pipeline. Publication-bias assessment using a funnel plot is shown in Figure 4.
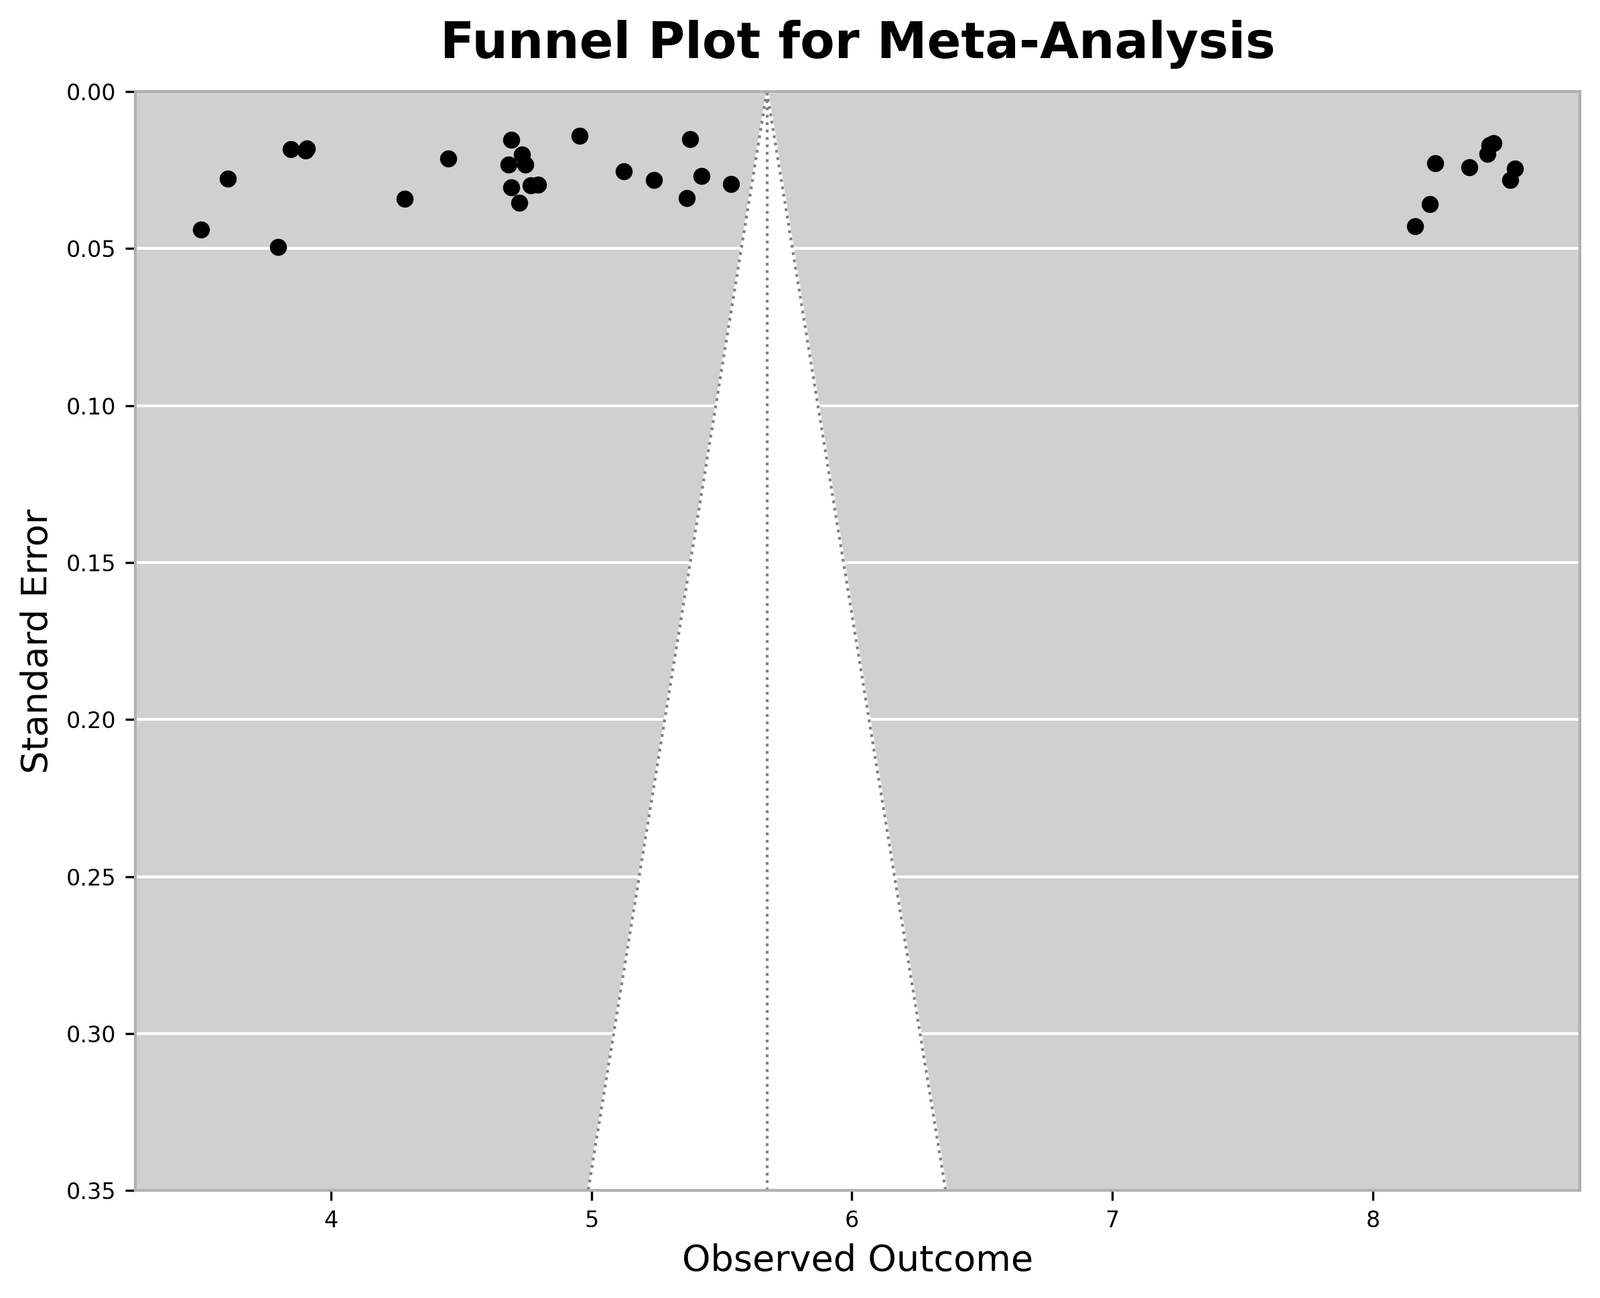
Figure 4. Synthetic Demonstration Funnel Plot
Subgroup Analysis
Subgroup analyses demonstrated observable differences among environmental matrices and pollutant classes. Simulated wastewater studies exhibited comparatively higher pooled concentration estimates than groundwater studies, whereas nitrate datasets demonstrated substantially larger concentration distributions compared with pharmaceutical micropollutants. Differences among geographical regions were also observed within the synthetic datasets, thereby illustrating the ability of the workflow to evaluate environmental variability across multiple subgroup categories. These subgroup analyses demonstrated the adaptability of the EnvChemMetaFlow framework for comparative environmental evidence synthesis. Subgroup-analysis outputs stratified by environmental matrix are summarized in Table 3.
Table 3. Subgroup Analysis by Water Types and Pollutants
| Subgroup | Studies (n) | Pooled Log Mean | I² (%) |
|---|---|---|---|
| Groundwater | 11 | 3.25 | 58 |
| Wastewater | 12 | 4.10 | 71 |
| Surface water | 9 | 3.62 | 64 |
| Fluoxetine | 8 | 3.75 | 42 |
| Ciprofloxacin | 8 | 4.55 | 49 |
| Nitrate | 8 | 8.22 | 81 |
Subgroup-analysis visualization stratified by environmental matrix is presented in Figure 5.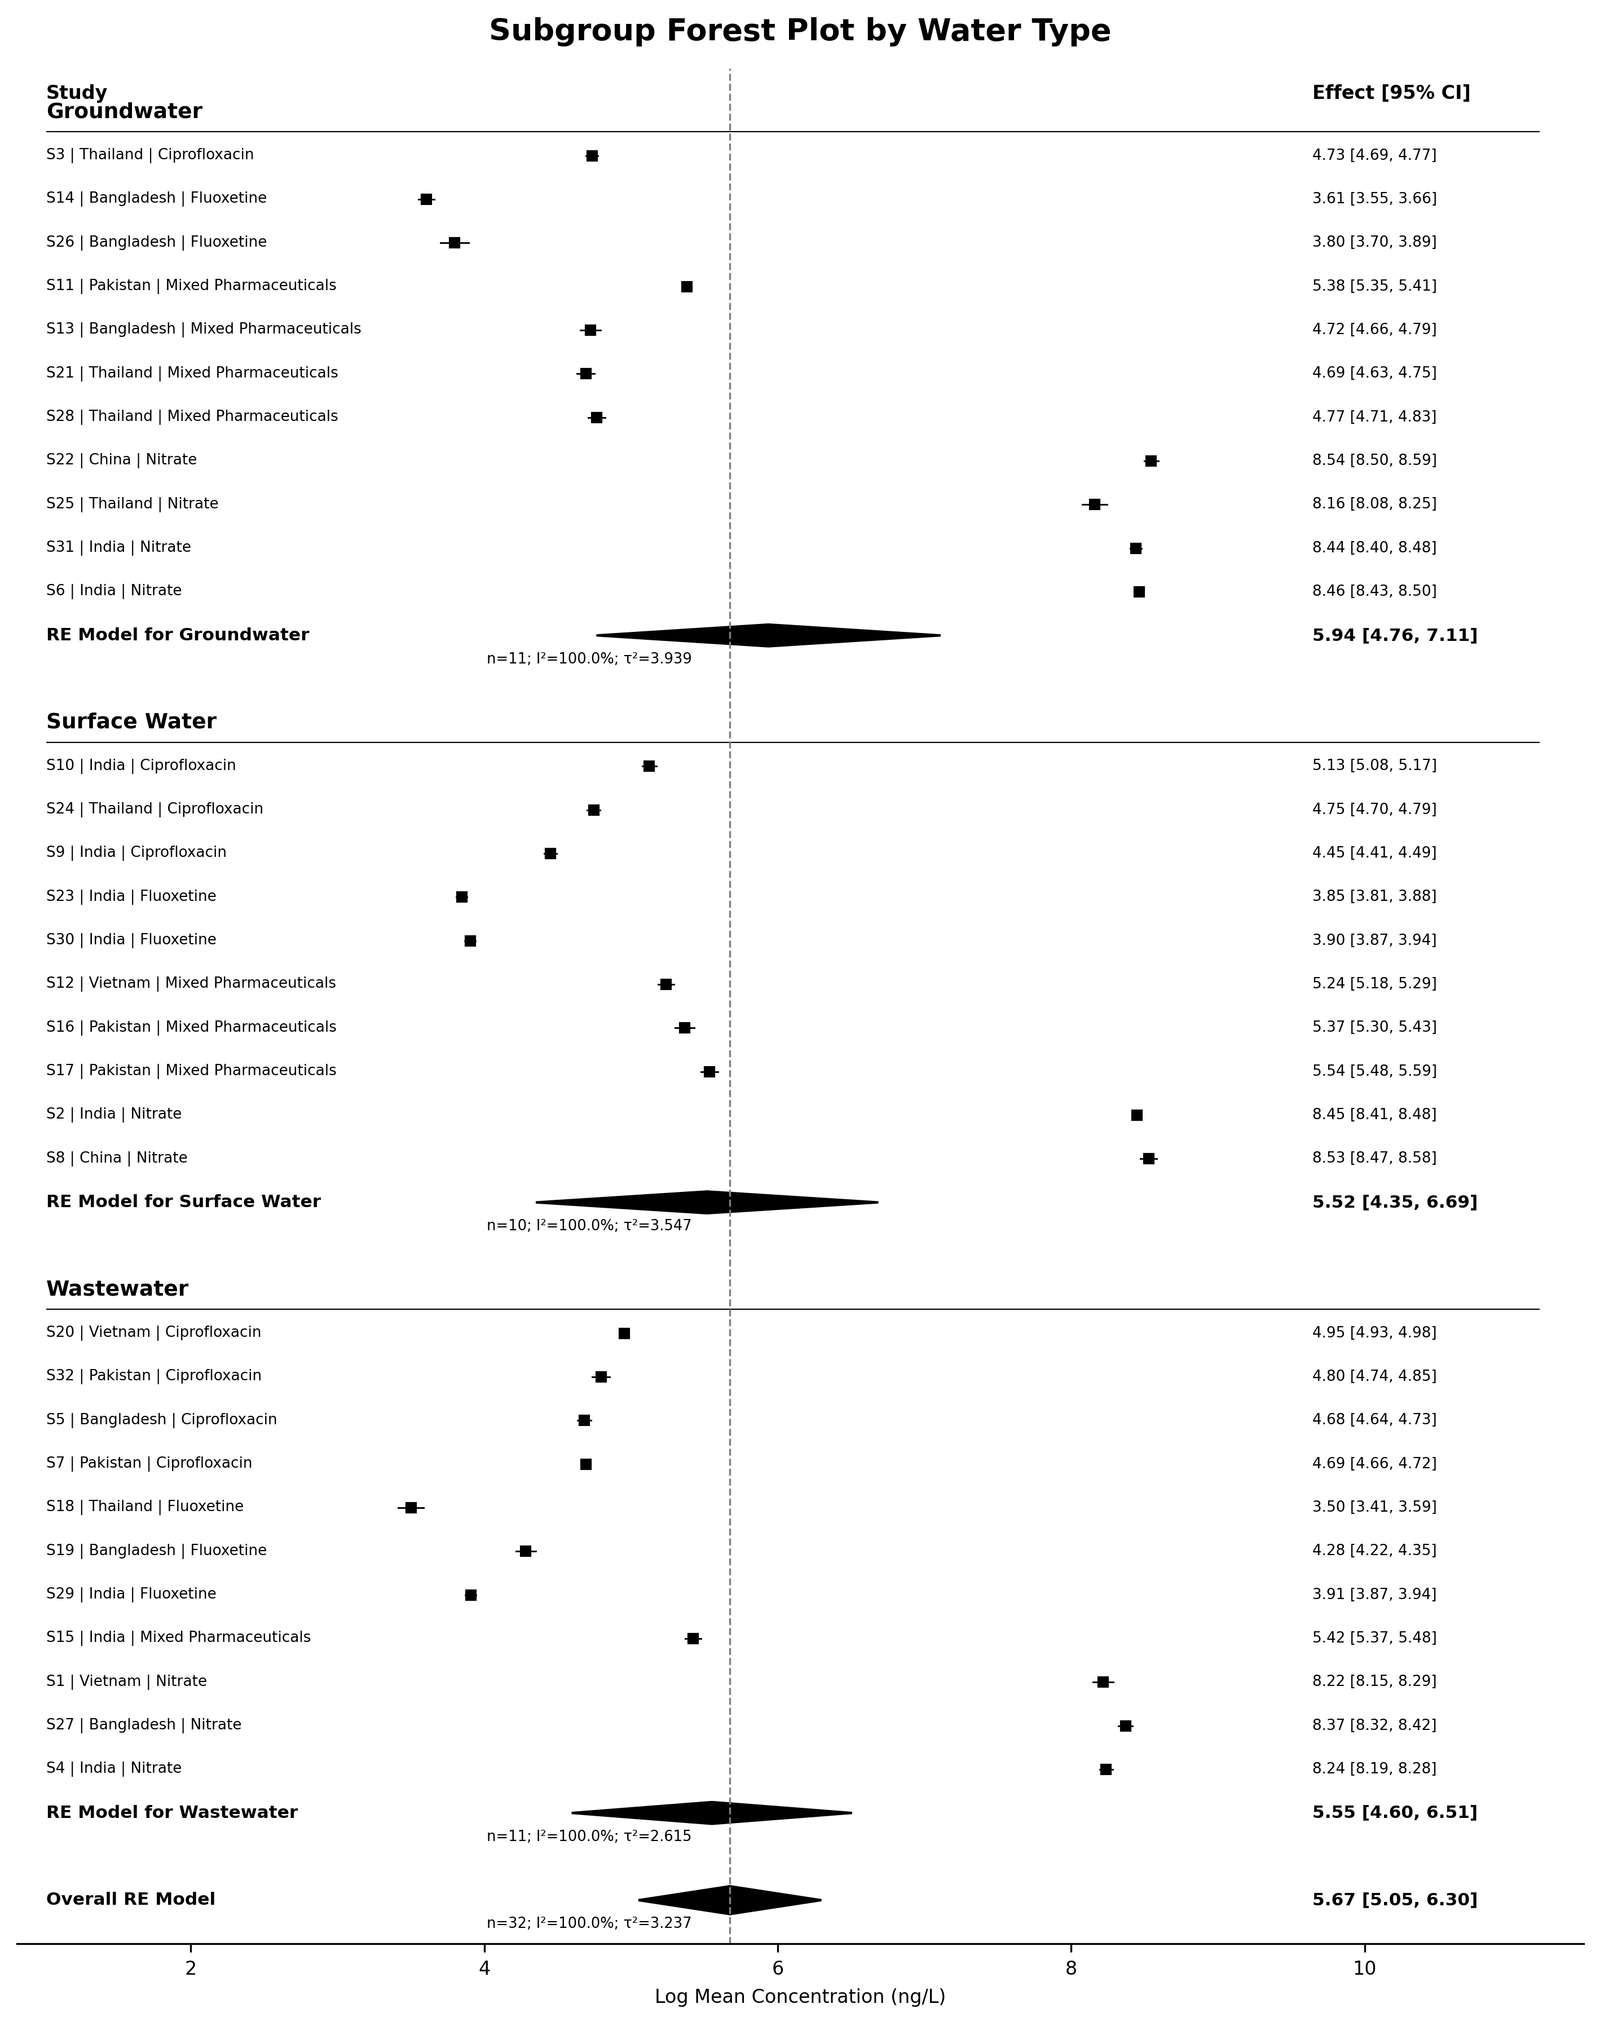
Figure 5. Subgroup Forest Plot by Water Types
Pollutant Distribution Heatmap
The pollutant-distribution heatmap demonstrated differential concentration distributions among pollutant categories and geographical regions. Nitrate-associated datasets demonstrated substantially higher concentration values relative to pharmaceutical micropollutant datasets, whereas mixed pharmaceutical residues demonstrated broader distribution patterns across wastewater-associated studies. The heatmap additionally illustrated the utility of the workflow for multidimensional visualization of heterogeneous environmental datasets. Pollutant-distribution variability across geographical regions is visualized in Figure 6.
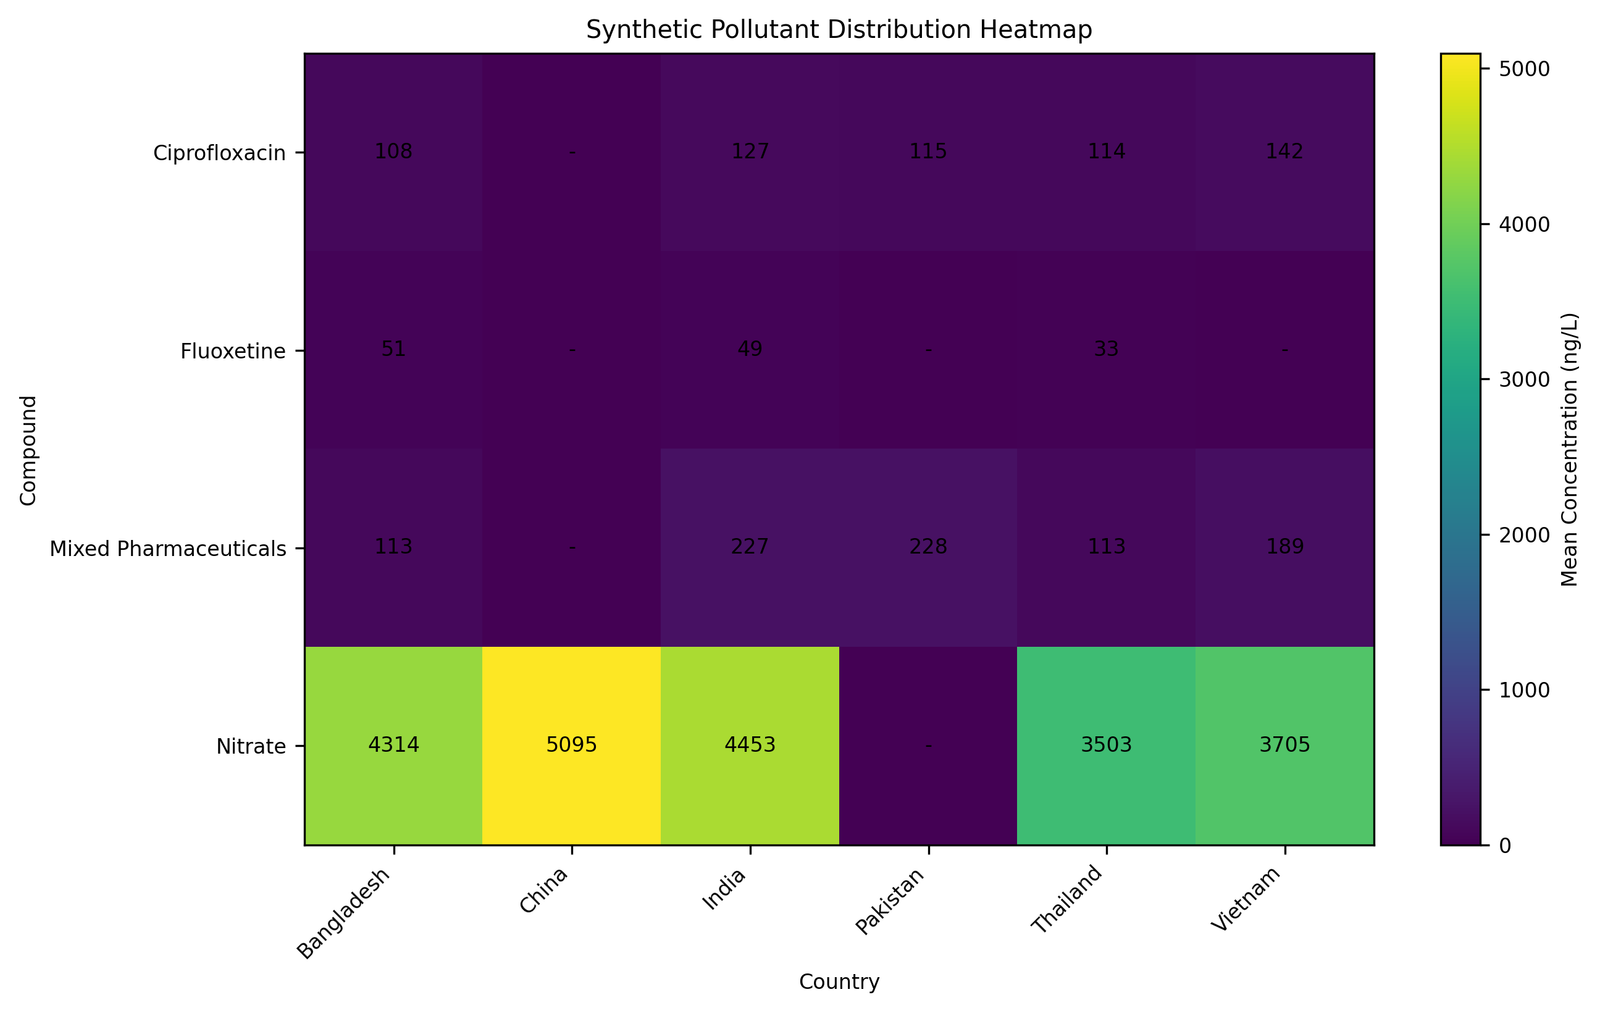
Figure 6. Pollutant distribution heatmap.
Meta-regression Demonstration
Meta-regression analysis suggested that environmental matrix type and compound category contributed substantially to between-study heterogeneity within the synthetic dataset. Sampling year demonstrated comparatively weaker moderating influence on pooled concentration variability. The meta-regression module successfully illustrated the ability of the proposed workflow to evaluate potential moderators influencing environmental concentration estimates while maintaining analytical reproducibility and computational transparency. Meta-regression demonstration outputs evaluating environmental matrix as a moderator are shown in Figure 7.
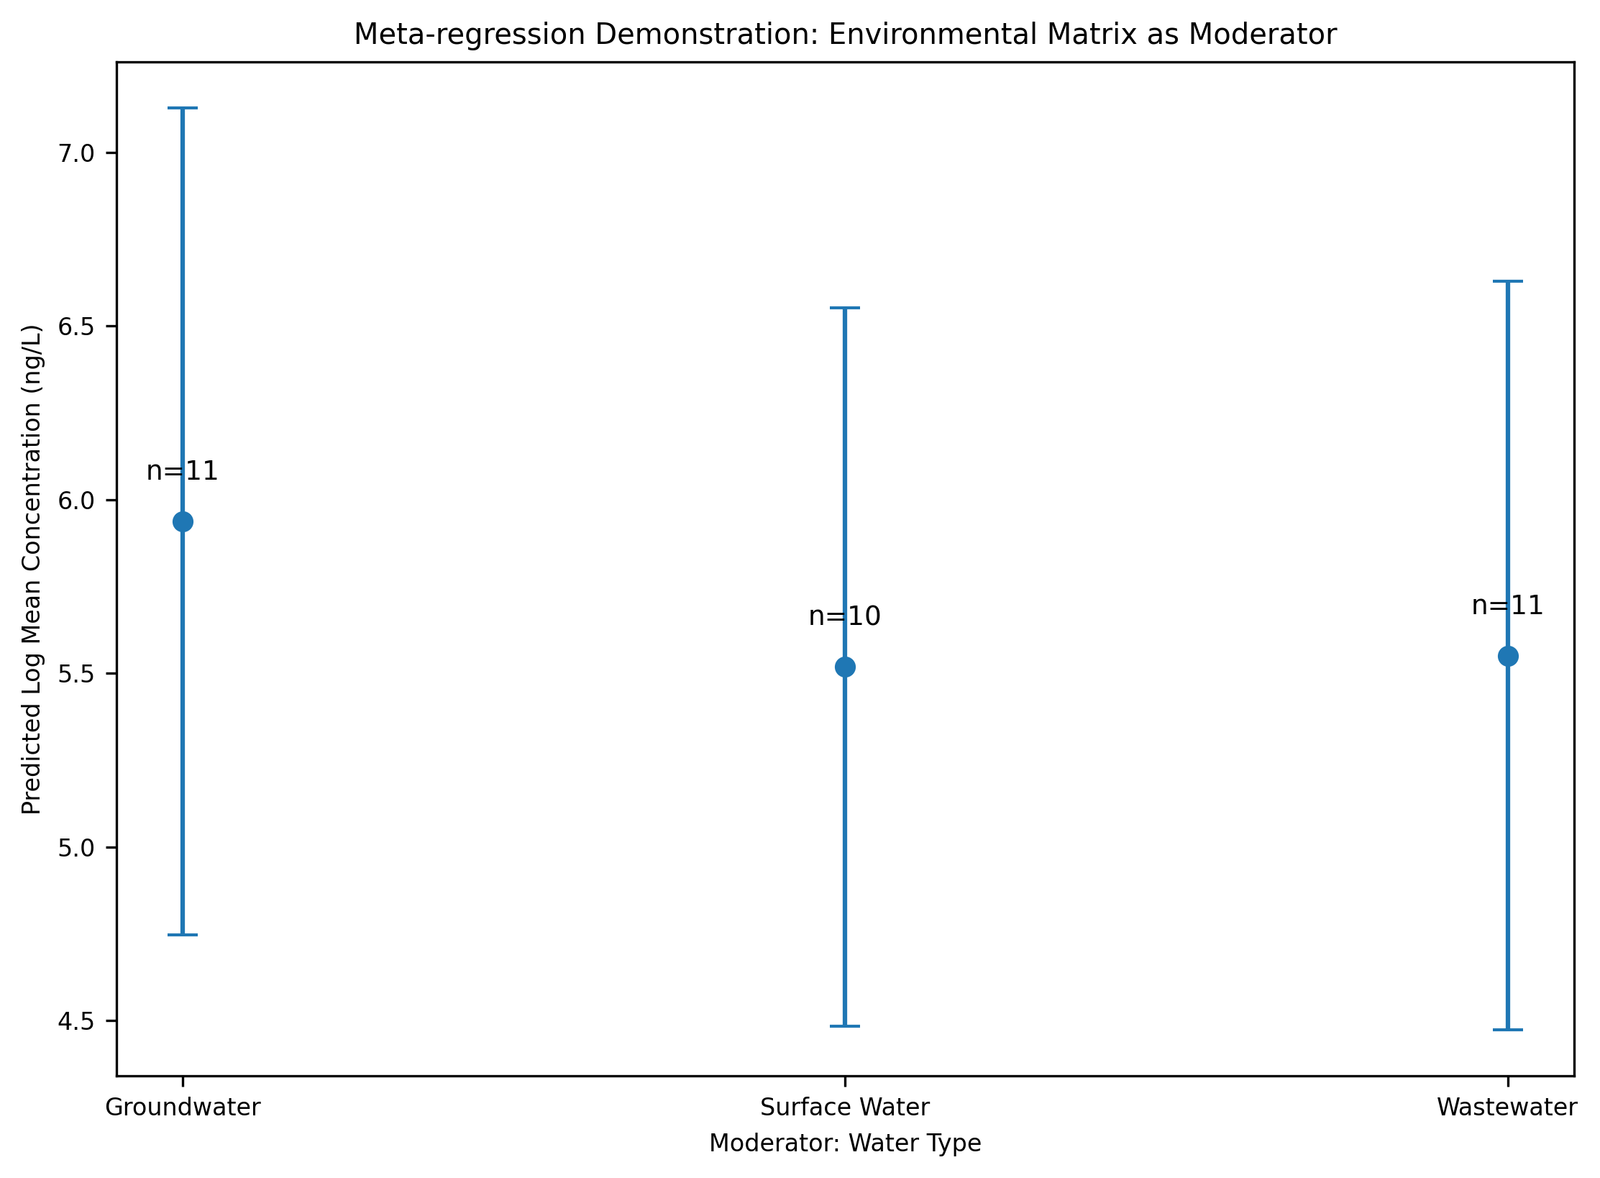
Figure 7. Meta-regression Demonstration
Discussion
The present study demonstrates the feasibility of a standardized and reproducible workflow for environmental chemical evidence synthesis. The EnvChemMetaFlow framework successfully integrated structured data extraction, automated harmonization, statistical meta-analysis, subgroup analysis, meta-regression, visualization, and reproducible reporting within a unified computational architecture. The synthetic demonstration datasets illustrated the ability of the workflow to manage heterogeneous environmental monitoring datasets while maintaining interoperability and methodological consistency. Automated unit harmonization reduced inconsistencies associated with concentration reporting, whereas script-based analytical procedures improved computational reproducibility and minimized undocumented data-transformation steps.
Importantly, the synthetic datasets were generated solely for methodological validation and workflow demonstration rather than environmental inference. Consequently, the presented concentration estimates and statistical outputs should not be interpreted as real environmental contamination levels. Instead, the generated outputs serve as computational demonstrations illustrating the functionality and reproducibility of the proposed framework. The workflow may provide substantial utility for graduate-level training, interdisciplinary environmental management education, and computational environmental chemistry research, particularly for researchers seeking standardized approaches for evidence synthesis and pollutant-data integration. The present framework additionally demonstrates how synthetic demonstration datasets may be ethically utilized for computational workflow validation, educational training, and reproducibility assessment without generating misleading environmental claims.
Nevertheless, several limitations should be acknowledged. First, the present study used synthetic datasets rather than real environmental monitoring data. Consequently, the statistical outputs should not be interpreted as evidence of actual pollutant distributions or ecological risk. Second, the workflow was demonstrated using relatively small simulated datasets. Future studies may incorporate large-scale real-world environmental datasets to further validate workflow scalability and analytical robustness.
Future research may additionally expand the framework toward integration of machine-learning approaches, geospatial environmental mapping, automated metadata extraction, cloud-based reproducible pipelines, and FAIR-compliant environmental repositories. Furthermore, incorporation of real-world environmental monitoring datasets and multi-omics environmental exposure data may further improve the applicability of the framework for large-scale environmental risk assessment and interdisciplinary pollutant-surveillance research.
Conclusion
EnvChemMetaFlow provides a standardized and reproducible framework for environmental chemical data management and meta-analysis using synthetic demonstration datasets. The workflow integrates systematic literature organization, structured environmental chemical data extraction, automated unit harmonization, quality assessment, statistical synthesis, subgroup analysis, visualization, and publication-ready reporting within a unified computational pipeline. Although the synthetic datasets used in the present study were generated exclusively for methodological demonstration, the proposed framework may substantially improve workflow standardization, computational reproducibility, and graduate-level training in environmental chemistry and environmental evidence synthesis research. The framework may additionally support interdisciplinary environmental management education and reproducible computational research for investigators from environmental science, public health, pharmaceutical sciences, data science, and management backgrounds.
About This Article
Acknowledgements
The authors would like to acknowledge the contributions of open-source scientific computing communities and reproducible research initiatives that inspired the development of the EnvChemMetaFlow framework. The authors additionally appreciate the availability of openly accessible R packages and environmental meta-analysis resources that supported the methodological development of this study.
Conflict of Interest
The authors declare that they have no known competing financial interests or personal relationships that could have influenced the work reported in this study.
Authors’ Contributions
TNE: Methodology development, synthetic dataset generation, statistical analysis, workflow design, visualization, manuscript writing, and final manuscript preparation. KEM: Conceptualization, literature organization, workflow validation, data management support, methodological review, manuscript editing, and supervision of computational reproducibility assessment. All authors read and approved the final manuscript.
Funding
This research received no external funding.
Resources and Data Availability
The synthetic datasets, analytical scripts, supplementary computational workflow files, and publication-ready visualization outputs generated during the present study are provided within the Supplementary Materials.
All analyses were performed using the R statistical environment with openly accessible packages including metafor, ggplot2, dplyr, readr, and openxlsx.
The datasets used in this study were synthetically generated exclusively for methodological demonstration and educational reproducibility purposes and do not represent real environmental monitoring observations.
Supplementary Files
Click to DownloadReferences
- Aib H, Parvez MS, Czédli HM. Pharmaceuticals and microplastics in aquatic environments: a comprehensive review of pathways and distribution, toxicological and ecological effects. Int J Environ Res Public Health. 2025;22(5):799. doi:10.3390/ijerph22050799. DOI PubMed PMC Google Scholar Link
- Tarigan M, Raji S, Al-Fatesh H, Czermak P, Ebrahimi M. The occurrence of micropollutants in the aquatic environment and technologies for their removal. Processes. 2025;13(3):843. doi:10.3390/pr13030843. DOI Google Scholar Link
- Thangrongthong S, Ladda B, Sittisom P. A review of antibiotic contamination in wastewater: sources, impacts, and microbial bioremediation techniques. Water Environ Res. 2025;97(7):e70118. doi:10.1002/wer.70118. DOI PubMed Google Scholar Link
- Maghsodian Z, Sanati AM, Mashifana T, Sillanpää M, Feng S, Nhat T, et al. Occurrence and distribution of antibiotics in the water, sediment, and biota of freshwater and marine environments: a review. Antibiotics (Basel). 2022;11(11):1461. doi:10.3390/antibiotics11111461. DOI PubMed PMC Link
- Wada OZ, Olawade DB. Recent occurrence of pharmaceuticals in freshwater, emerging treatment technologies, and future considerations: a review. Chemosphere. 2025;374:144153. doi:10.1016/j.chemosphere.2025.144153. DOI PubMed Google Scholar Link
- Pavi CP, Elois MA, Jempierre YFSH, et al. Micropollutants and their interactions with relevant environmental viruses. Environ Microbiol. 2025;27(10):e70184. doi:10.1111/1462-2920.70184. DOI PubMed PMC Google Scholar Link
- Sanchez-Huerta C, Baasher F, Wang C, Zhang S, Hong PY. Global occurrence of organic micropollutants in surface and ground water: highlighting the importance of wastewater sanitation to tackle organic micropollutants. J Environ Chem Eng. 2024;12(3):112861. doi:10.1016/j.jece.2024.112861. DOI Google Scholar Link
- Fernandes MJ, Paíga P, Silva A, Pérez Llaguno C, Carvalho M, Macías Vázquez F, et al. Antibiotics and antidepressants occurrence in surface waters and sediments collected in the north of Portugal. Chemosphere. 2020;239:124729. doi:10.1016/j.chemosphere.2019.124729. DOI PubMed Google Scholar Link
- Chen Y, Wang J, Xu P, Xiang J, Xu D, Cheng P, et al. Antidepressants as emerging contaminants: occurrence in wastewater treatment plants and surface waters in Hangzhou, China. Front Public Health. 2022;10:963257. doi:10.3389/fpubh.2022.963257. DOI PubMed PMC Google Scholar Link
- Alaska Department of Environmental Conservation. Contaminant concentrations [Internet]. Available from: https://dec.alaska.gov/ Link
- Water Knowledge for All. Units for pollutant concentrations [Internet]. Available from: https://waterknowledgeforall.com/ Link
- Wilkinson MD, Dumontier M, Aalbersberg IJ, Appleton G, Axton M, Baak A, et al. The FAIR guiding principles for scientific data management and stewardship. Sci Data. 2016;3:160018. doi:10.1038/sdata.2016.18. DOI Google Scholar Link
- Page MJ, McKenzie JE, Bossuyt PM, Boutron I, Hoffmann TC, Mulrow CD, et al. The PRISMA 2020 statement: an updated guideline for reporting systematic reviews. BMJ. 372 :n71 doi:10.1136/bmj.n71. DOI PubMed PMC Google Scholar Link
- O'Brien M, Smith C, Gries C. Thematic harmonization of environmental data: facilitating interoperability of data within and among repositories in support of data reuse and scientific synthesis. ESS Open Archive. 2019. doi:10.1002/essoar.10501268.1. DOI Google Scholar Link
- Leipzig J, Nüst D, Hoyt CT, Ram K, Greenberg J. The role of metadata in reproducible computational research. Patterns (N Y). 2021;2(9):100322. doi:10.1016/j.patter.2021.100322. DOI PubMed PMC Link
- Lortie CJ, Filazzola A. A contrast of meta and metafor packages for meta-analyses in R. Ecol Evol. 2020;10(20):10916-10921. doi:10.1002/ece3.6747. DOI PubMed PMC Google Scholar Link
- Balduzzi S, Rücker G, Schwarzer G. How to perform a meta-analysis with R: a practical tutorial. Evid Based Ment Health. 2019;22(4):153-160. doi:10.1136/ebmental-2019-300117. DOI PubMed PMC Google Scholar Link
- Wickham H. ggplot2: elegant graphics for data analysis. New York: Springer-Verlag; 2016. Link
- Wickham H, François R, Henry L, Müller K, Vaughan D. dplyr: a grammar of data manipulation. R package version 1.2.1. 2026. Available from: https://dplyr.tidyverse.org Link
- Wickham H, Hester J, Bryan J. readr: read rectangular text data. R package version 2.2.0. 2026. Available from: https://readr.tidyverse.org Link
- Schauberger P, Walker A. openxlsx: read, write and edit xlsx files. R package version 4.2.8.1. 2026. Available from: https://github.com/ycphs/openxlsx Link
- Tanriver-Ayder E, Faes C, van de Casteele T, McCann SK, Macleod MR. Comparison of commonly used methods in random effects meta-analysis: application to preclinical data in drug discovery research. BMJ Open Sci. 2021;5(1):e100074. doi:10.1136/bmjos-2020-100074. DOI PubMed PMC Google Scholar Link
- Higgins JPT, Thompson SG, Deeks JJ, Altman DG. Measuring inconsistency in meta-analyses. BMJ. 2003;327:557. doi:10.1136/bmj.327.7414.557. DOI PubMed PMC Google Scholar Link
- Shuster JJ. Discussion of ‘Misunderstandings about Q and “Cochran's Q Test” in meta-analysis’. Stat Med. 2016;35:498-500. doi:10.1002/sim.6762. DOI PubMed Google Scholar Link
- Lin L, Chu H. Quantifying publication bias in meta-analysis. Biometrics. 2018;74(3):785-794. doi:10.1111/biom.12817. DOI PubMed PMC Google Scholar Link
Change History
| Revision Number | Date | Details Of Changes |
|---|---|---|
| 1 | 2026-04-23 | The article in its accepted form (PPD/AMIN/251218/1) |